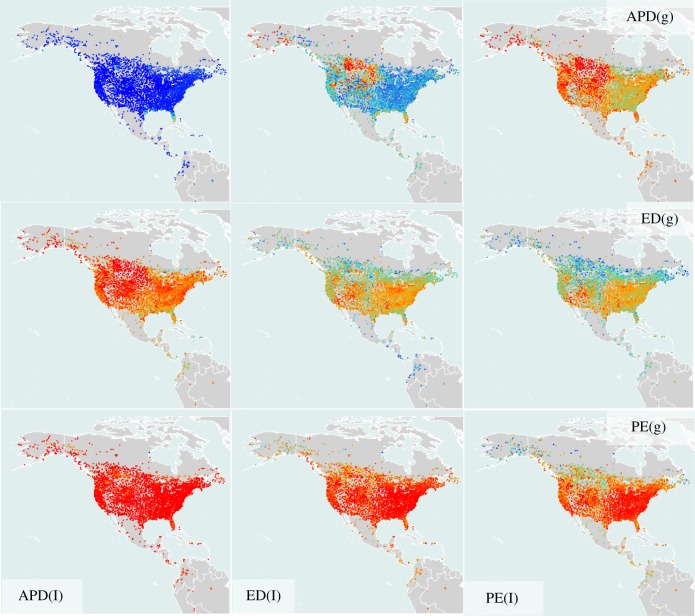
Figure 2.
Map of correlations between local evolutionary isolation scores (l) and global evolutionary isolation scores (g) for 4628 bird communities for three different measures of evolutionary isolation—descriptions in text. Blue colours are higher correlation (light blue is a coefficient of approximately 0.7; dark blue represents a value tending to 1), orange-red colours show weaker correlation (red represents a correlation coefficient of 0 to around 0.4; orange around 0.55). (Online version in colour.)

