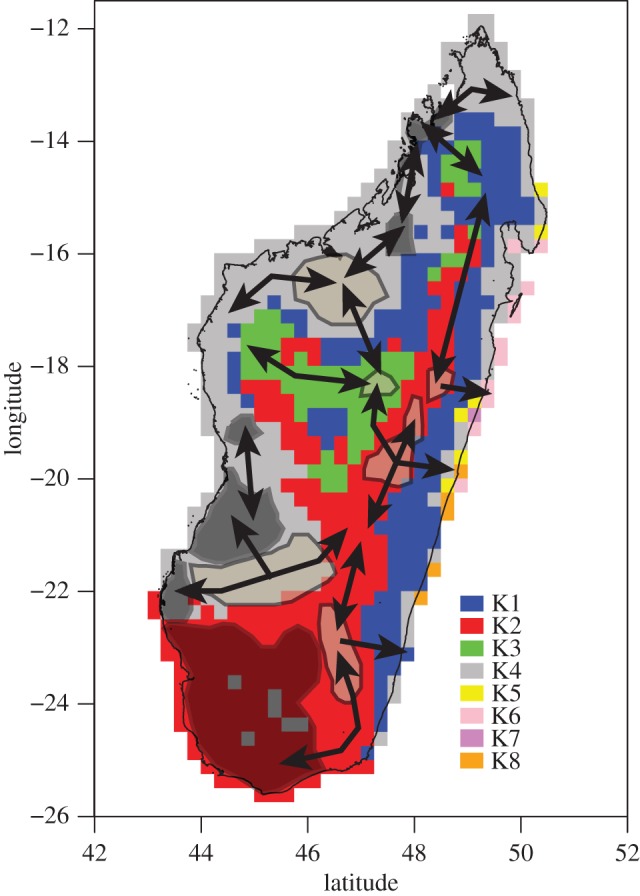
Figure 4.

Depiction of the putative network of refugia (polygons) and dispersal corridors (arrows) used by legume communities during the Quaternary climatic oscillations. Evolutionary units (K1–8) are also displayed (see text for details). Dark grey polygons represent low elevation refugia, and light grey polygons represent those found at high elevations.
