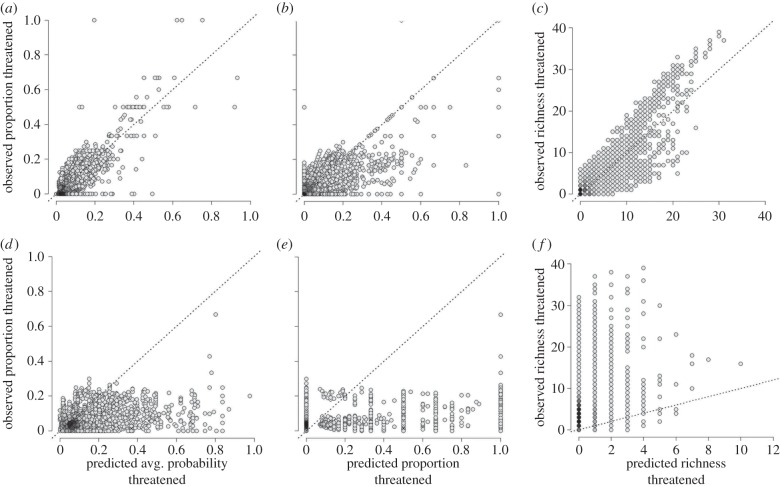
Figure 4.
Relationships between observed and predicted threat levels of grid cell assemblages. The model-based predictions of average probability (a) and total proportion (b) of species threatened successfully captures the observed variation in proportion species threatened ((a) Spearman's r = 0.72; (b) r = 0.66; 3,703 species; cf. figure 3a,b). Observed and predicted richness of threatened assessed species is tightly associated ((c) r = 0.77, cf. figure 3d). By contrast, the predicted average threat levels and proportions of data-deficient species (cf. figure 3c) show only very weak association with the proportional threat patterns of assessed species ((d) r = 0.33; (e) r = 0.23; 843 data-deficient species). Equally, the areas with high richness of data-deficient species predicted to be threatened shows little covariance with those of high assessed threatened richness ((f) r = 0.31, cf. figure 3f). Darker grey represent higher density of points, line indicates a 1 : 1 relationship. A total of 11 331 110 km equal area grid cells that had more than or equal to 50% dry land or were oceanic islands and had more than or equal to 2 assessed species were analysed.

