
Figure 1. L4 in M1 as a zone of Rorb expression.
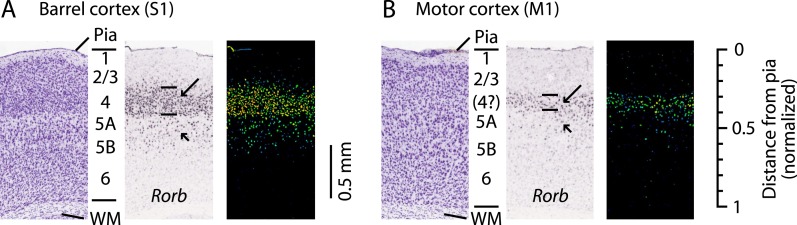
Images are from the Allen Mouse Brain Atlas (http://mouse.brain-map.org/) (Lein et al., 2007) showing coronal sections for Rorb in situ hybridization (probe Rorb-RP_071018_01_H03) and corresponding Nissl stains. (A) S1 labeling. In a Nissl-stained section (left), L4 is readily identifiable due to cell density differences across layers. In situ hybridization labeling of Rorb (center, with corresponding expression intensity image shown on the right) is the strongest in L4 (long arrow, with borders indicated by lines), with weaker labeling present in L5A/B (short arrow). (B) M1 labeling. Nissl stain (left) showing a region of the lateral agranular cortex corresponding to the forelimb representation area of M1 (same section as in panel A). L4 is not readily identifiable based on cell density differences alone. Nevertheless, in situ hybridization against Rorb (center and right) shows the strongest labeling in a laminar zone corresponding to L4 in S1 (long arrow, with borders indicated by lines), with weaker labeling present in L5A/B (short arrow). Scale on the far right shows the normalized cortical distance from pia to white matter (WM). The approximate location of the cortical layers is indicated, based on prior quantitative analysis of the bright-field optical appearance of M1 layers (Weiler et al., 2008).