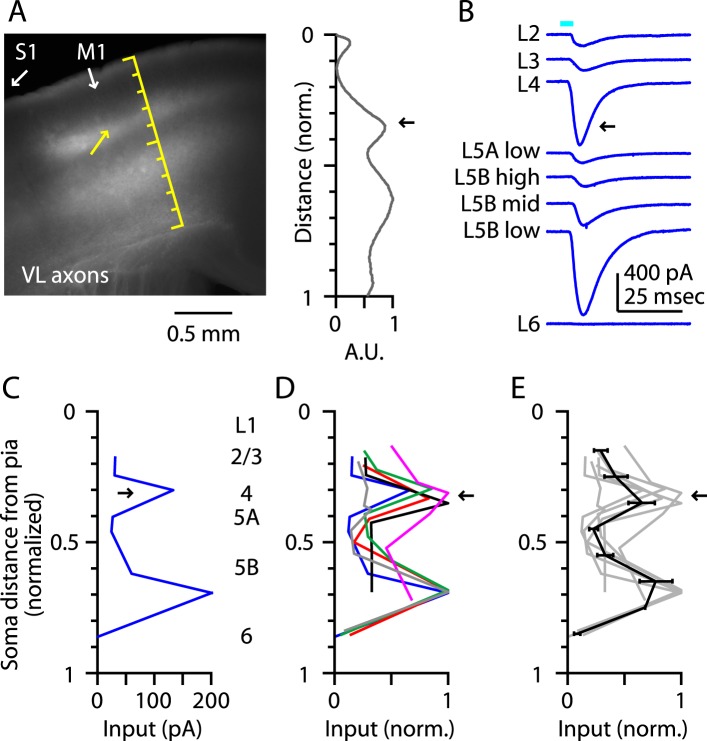
Figure 2. Thalamocortical (TC) input to M1-L4 neurons from VL.
(A) Epifluorescence image of coronal slice containing M1, showing laminar pattern of labeled thalamocortical axons following injection of AAV carrying ChR2 and GFP in the ventrolateral (VL) region of the thalamus. S1 cortex is located laterally (to the left, as indicated). Scale shows normalized cortical distance. Yellow arrow indicates laminar zone of labeling where strong photostimulation-evoked electrophysiological responses were also detected. Plot to the right shows laminar profile of fluorescence intensity, in arbitrary units (A.U.), across layers (normalized distance from pia). (B) Responses recorded (sequentially) in vitro in multiple M1 neurons in different layers (as indicated) to photostimulation of ChR2-labeled axons originating from motor thalamus (VL) neurons (Hooks et al., 2013). (C) Laminar profile of VL input to M1 neurons. The profile exhibits two peaks, one in the upper ∼1/3 of the cortex (corresponding to L4) and the other in the lower part (corresponding to L5B). (D) Laminar profiles obtained from multiple slices (n = 6). Most profiles show a clear peak at a normalized depth of ∼1/3 (black arrow). (E) Average laminar profile (black; bars: s.e.m.), calculated by binning the data for each profile (bin width: 1/10 of the normalized cortical depth), averaging within each bin, and then averaging across all profiles. The individual profiles are also shown (gray).

