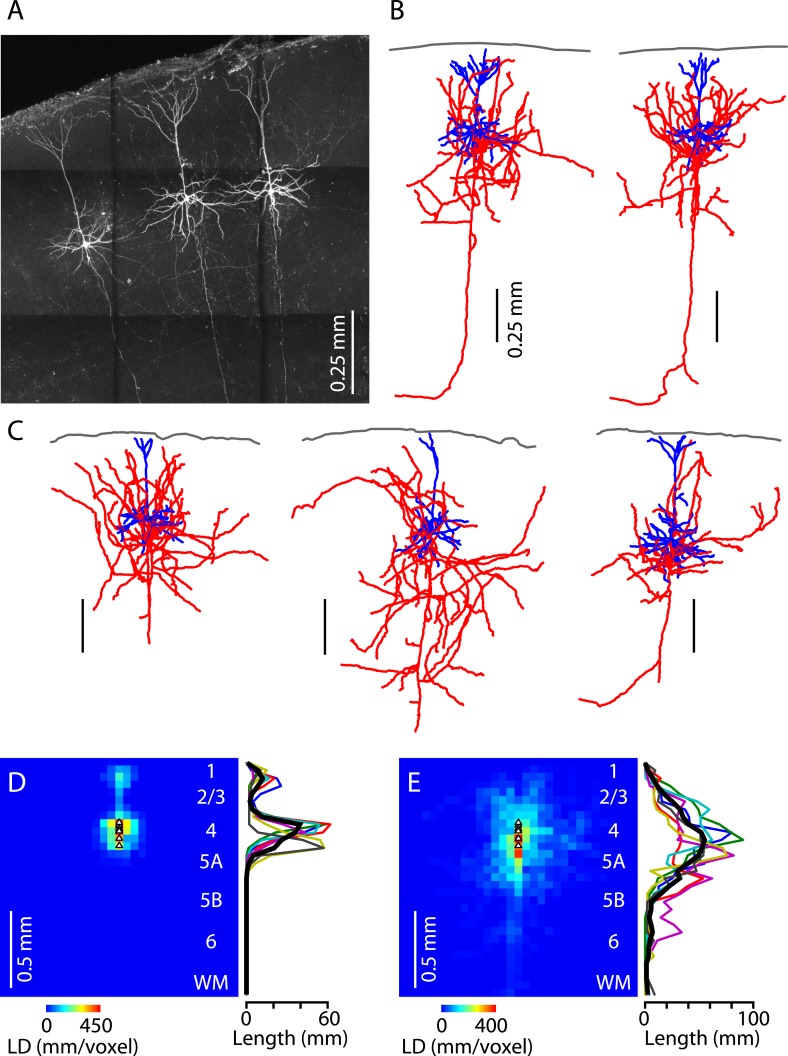
Figure 8. Morphological properties of M1-L4 neurons.
(A) Example fluorescence image of M1-L4 neurons. The neurons were filled with biocytin during whole-cell recordings, fixed and fluorescently labeled, and imaged with a two-photon microscope. The image is a maximum-intensity projection of multiple aligned image stacks. (B) Three-dimensional reconstructions of the two L4 neurons in the center and right of the image are shown in panel A. Dendrites are blue, axons are red, and the pia is drawn across the top. (C) Three more examples. (D) Quantitative analysis of dendritic morphology. The three-dimensional digital reconstructions (n = 6 neurons) of L4 neurons' dendrites were converted to two-dimensional length–density maps and averaged. Plot to the right shows the same data as a vertical profile (black: group mean ± s.e.m.; colored lines, individual neurons). (E) Same analysis, for the axons of the same neurons.

