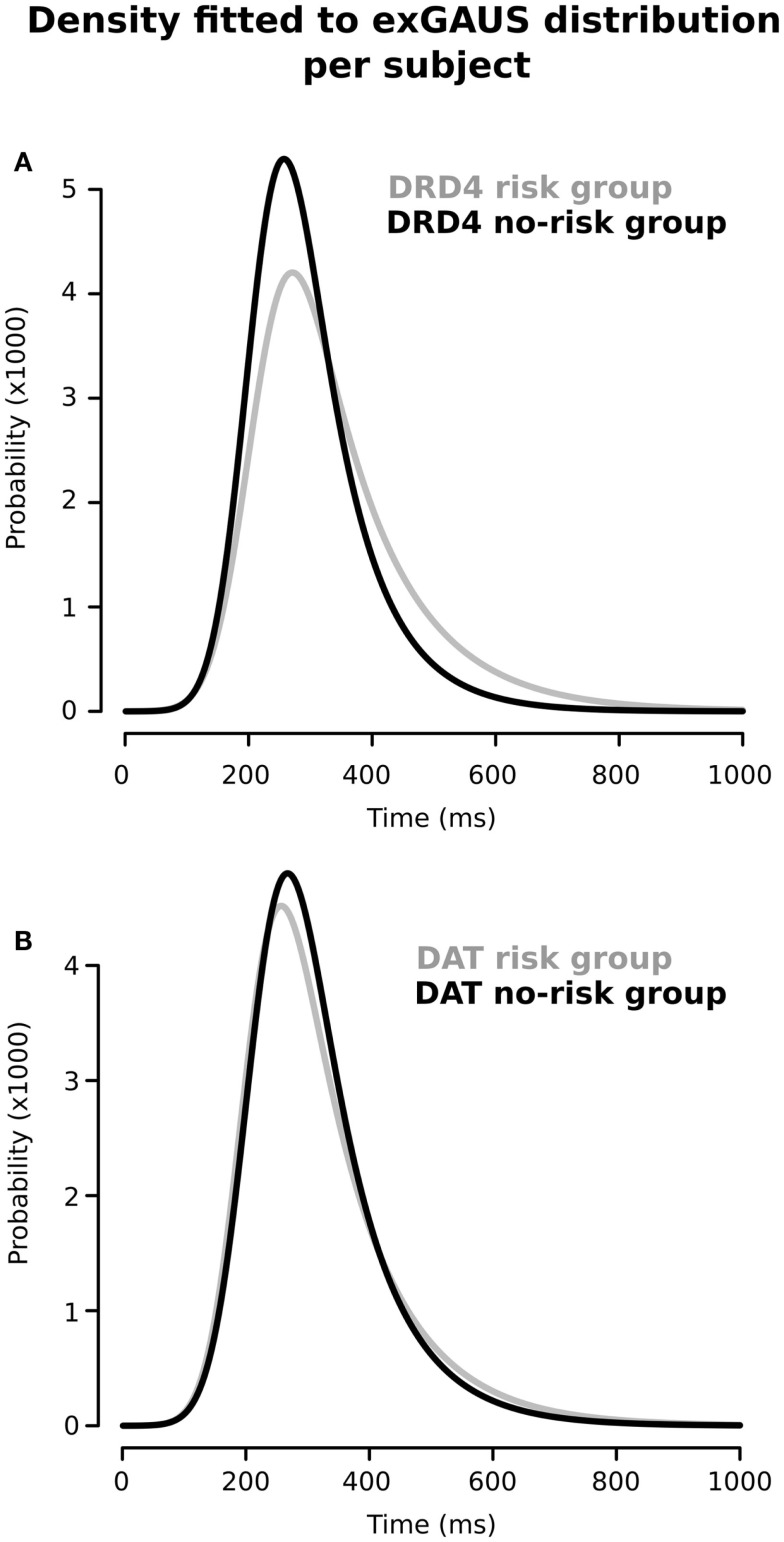
Figure 2.
Ex-Gaussian distributions for response times according to the presence/absence of previously described genetic risk variants for (A) DRD4 and (B) SCL6A3/DAT1. Black line: absence of risk alleles; gray line: presence of at least one risk allele (for a detailed description on group assignment criteria, please refer to Sections “Materials and Methods,” and Sections “Group Comparisons”).

