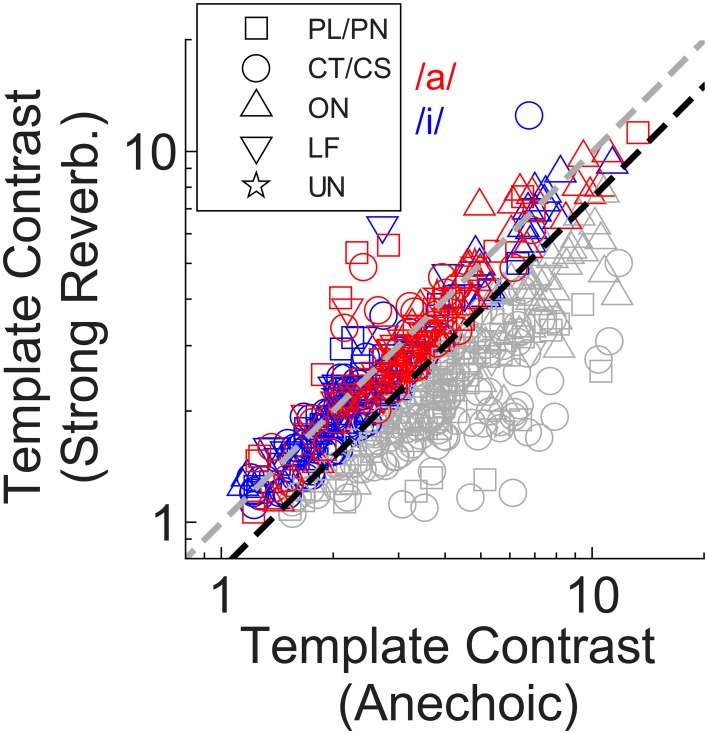
Figure 7.
Template contrast in response to static-F0 vowels: strong reverberation plotted vs. anechoic condition. Colored symbols indicate those responses for which template contrast in response to the vowel in strong reverberation is ≥ 0.75 times the contrast in response to the same vowel under anechoic conditions. Gray symbols < 0.75 times. Black dashed line has a slope of 0.75. Gray dashed line indicates equality (slope = 1). The choice of 0.75 as a criterion is arbitrary.

