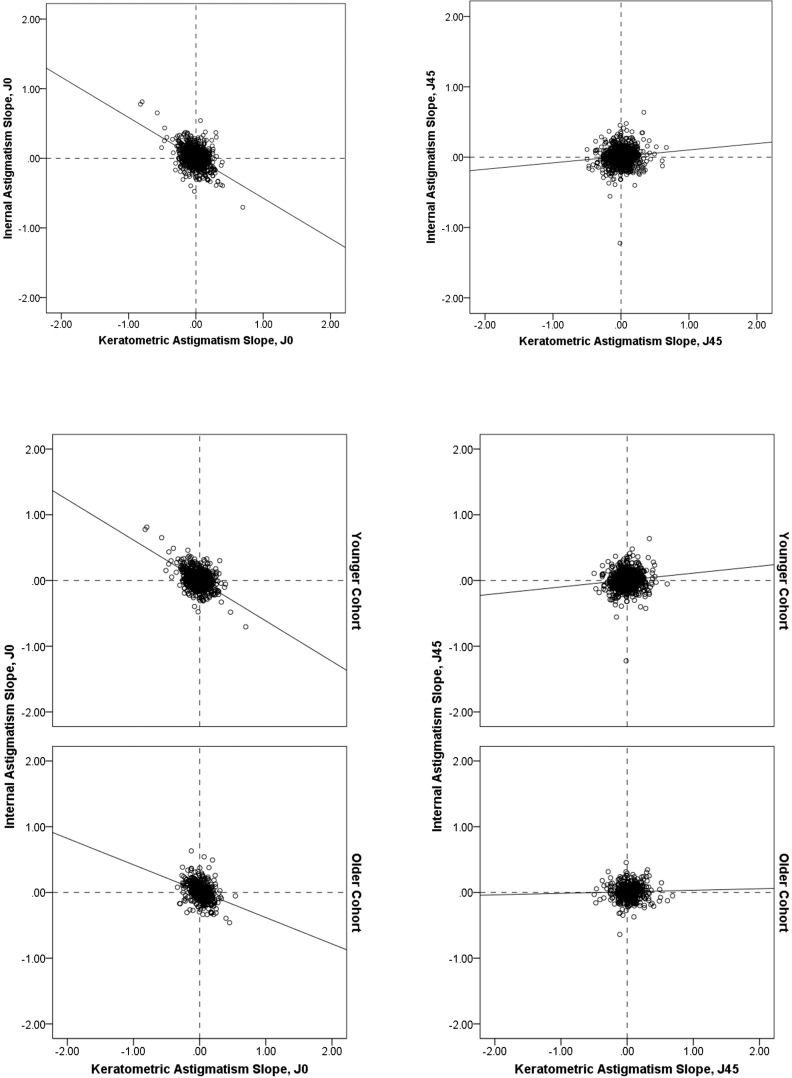
Figure 2.
Scatterplots of slope data for keratometric astigmatism (x-axis) and internal astigmatism (y-axis) measurements of J0 (left) and J45 (right) for the full dataset (top) and for the younger cohort (center) and older cohort (bottom). Positive slope for J0 reflects shift toward increasing with-the-rule/decreasing against-the-rule astigmatism; negative slope for J0 indicates shift toward decreasing with-the-rule/increasing against-the-rule astigmatism.

