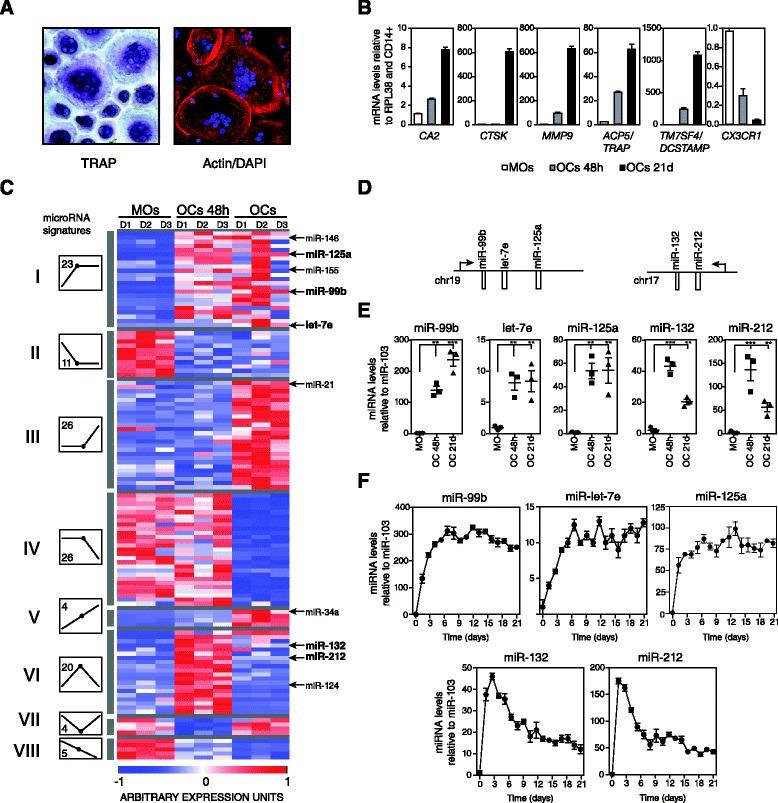
Figure 1.

MicroRNA expression profiling during monocyte-to-osteoclast differentiation. (A) Validation of the presence of OCs by TRAP and phalloidin staining, showing the presence of TRAP activity/multiple nuclei and the actin ring, respectively. (B) Molecular characterization of OC differentiation. Several OC markers are upregulated (CA2, CTSK, MMP9, ACP5/TRAP, and TM7SF4/DCSTAMP), and the MO marker CX3CR1 is silenced. Data for MOs, MOs 48 h after M-CSF and RANKL treatment and OCs at 21 days are presented. RPL38 gene expression levels were used for normalization. Error bars correspond to the standard deviation of three individual measurements. (C) Heatmap showing expression array data from the miRNA expression screening. miRNAs were subdivided into eight groups (I to VIII) according to their expression profile (diagram); the number of miRNAs in each group is indicated inside the expression dynamics diagram. Scale shown at the bottom, whereby normalized expression units ranges from -1 (blue) to +1 (red). (D) Representation of the genomic distribution of miR-99b/125a/let7e and miR-132/212 clusters, including the TSS (indicated with an arrow). (E) Validation of array data by quantitative PCR in independent biological replicates. Analysis in MOs, MOs incubated 48 h with RANKL/M-CSF and fully differentiated OCs. Data normalized with respect to miR-103. (F) Expression dynamics of the indicated miRNAs during OC differentiation, also normalized with respect to miR-103.
