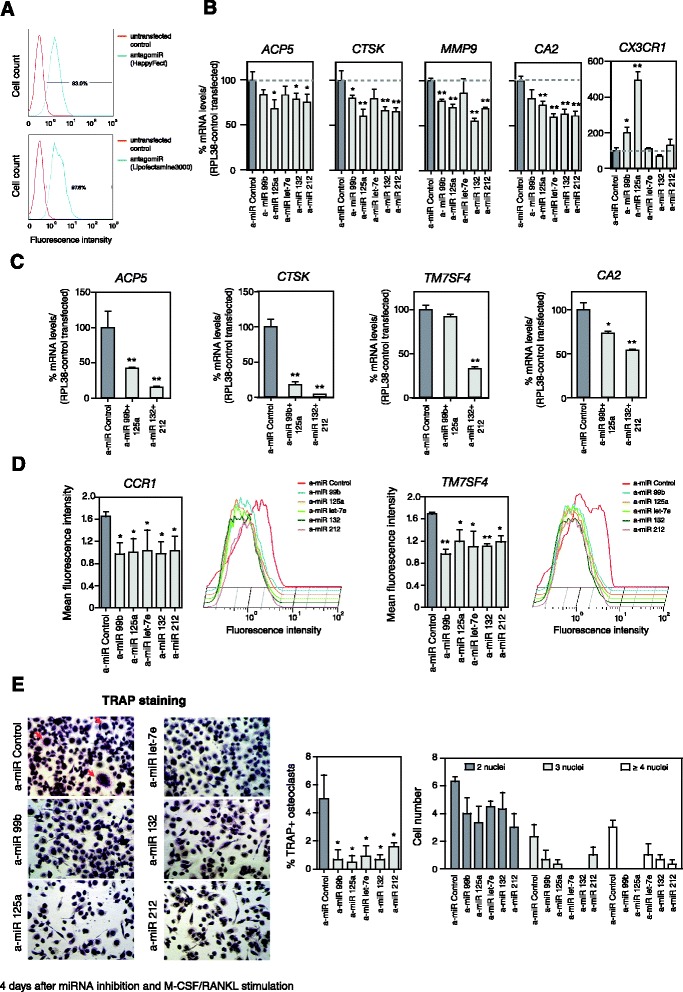
Figure 2.

Influence of miRNAs in modulating monocyte-to-osteoclast differentiation. (A) Quantification by flow cytometry of the transfection efficiency using a fluorescent control power inhibitor or antagomir. (B) Functional effect of miRNA inhibition using power inhibitors (or antagomirs) for the individual miRNAs in the miR-99b/125a/let7e and miR-132/212 clusters on CA2, CTSK, MMP9, ACP5 and CX3CR1 expression levels 4 days after M-CSF/RANL stimulation. Quantification was done using qRT-PCR with specific primers for each gene and using the RPL38 gene for normalization. (C) Functional effect of miRNA inhibition using double transfections with power inhibitors for two miRNAs within the miR-99b/125a/let7e and miR-132/212 clusters. Quantification was carried out using qRT-PCR with specific primers for each gene and using the RPL38 gene for normalization. (D) Effect of miRNA inhibition on the levels of surface markers CCR1 and TM7SF4. A bar diagram summarizing the results of the individual inhibition of each miRNA of the two clusters is presented. Also, a plot of the fluorescence-activated cell sorting (FACS) analysis is presented. (E) Effect of miRNA inhibition on the ability of cells to differentiate in OCs. Cells were arrested at 4 days after inducing differentiation. OCs were stained with TRAP. Cells with three or more nuclei were counted as OCs. In the images, multinuclear OCs are indicated with a red arrow. On the right, a bar diagram showing the percentage of OCs under each condition (center) and a bar diagram showing the number of cells with two, three or four or more nuclei under each condition (right). Error bars correspond to the standard deviation of three independent measurements; *corresponds to P-value <0.05; **means P-value <0.01.
