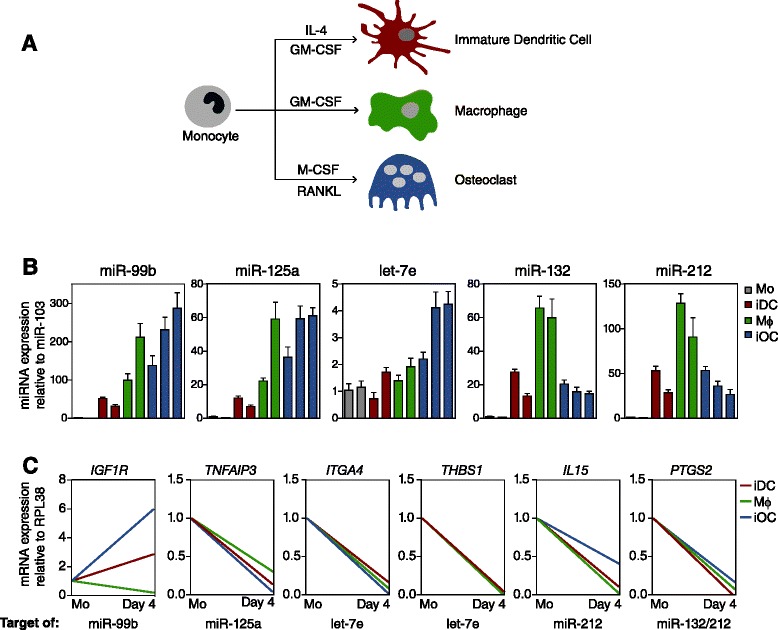
Figure 4.

Comparison of changes in the expression levels of the miRNAs within the miR-99b/125a/let7e and miR-132/212 clusters during osteoclast differentiation, and changes during monocyte-to-macrophage and monocyte-to-dendritic cell differentiation. (A) Diagram depicting the three differentiation models used in this experiment. GM-CSF, granulocyte-macrophage colony-stimulating factor. (B) Relative expression levels of the miRNAs in matching samples of MOs (grey), immature dendritic cells (iDC, red), macrophages (green,) and monocytes stimulated with RANKL/M-CSF after 1, 2 and 4 days (immature OCs (iOC) (blue)). qRT-PCR data were normalized with respect to miR-103. (C) Relative expression levels of miRNA targets in the same set of samples. qRT-PCR data were normalized with respect to the RPL38 gene. Error bars correspond to standard deviation of three independent measurements.
