FIG. 6.
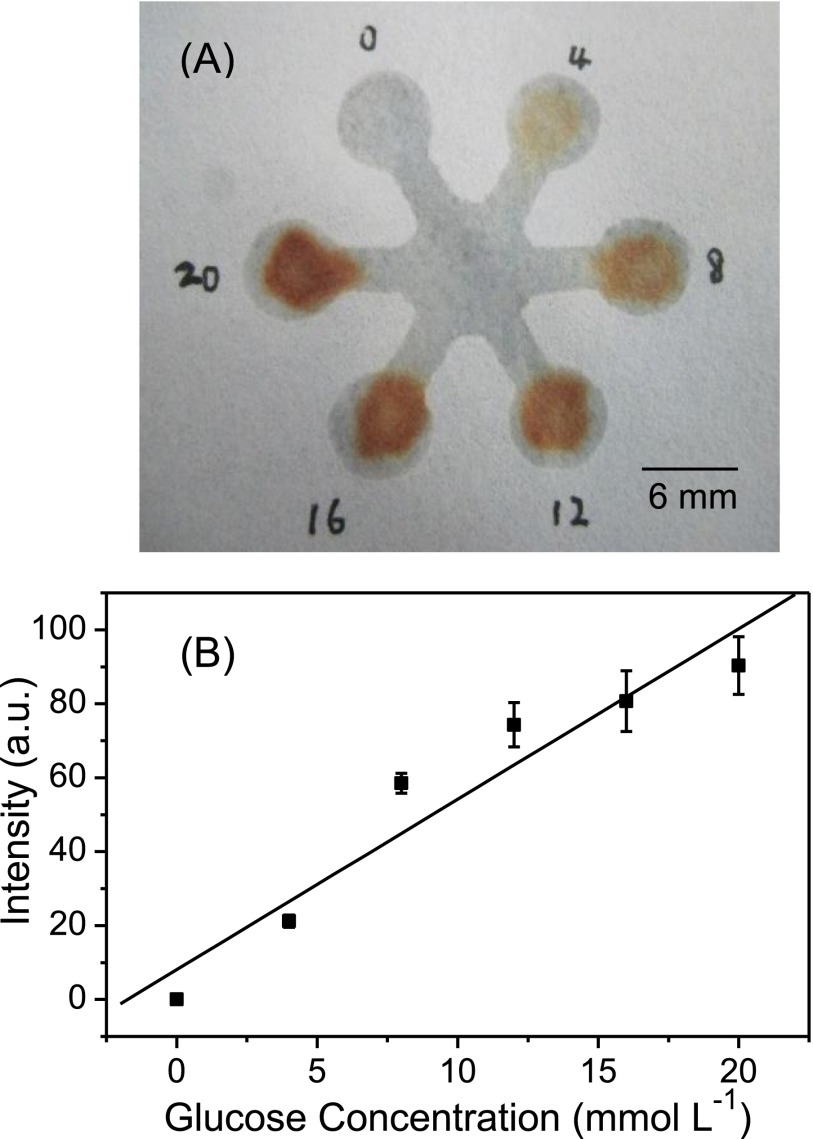
(a) Photograph of glucose assay performed on the μPAD with varied glucose concentration in a range of 0–20 mmol l−1. (b) Linear correlation between gray intensity and glucose concentration. The data were obtained from three repetitive experiments. The gray value was measured by the ImageJ software after the subtraction of blank gray value.

