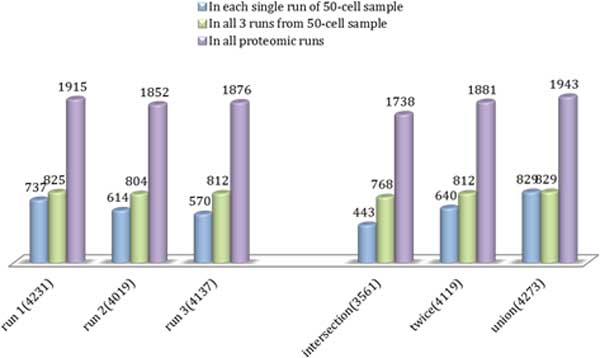
Figure 5.

The numbers of mapped genes (from enriched gene sets in canonical pathway collection) generated from 50-cell proteomics data. The six groups of bars represent the result of each run in 50-cell sample, intersection of three runs, at least shown in two runs, and union of three runs. The numbers in brackets after group name are the numbers of mapped genes in enriched gene sets derived from detected targets in six groups. In each group, the bars represent the number of overlapping genes between mapped genes and 1) detected targets in respective group(blue bars), 2) detected targets in all three runs of 50-cell sample (green bars), and 3) detected targets in all proteomics runs, including 100-, 500-, 1500-, 5000-cells samples (purple bars).
