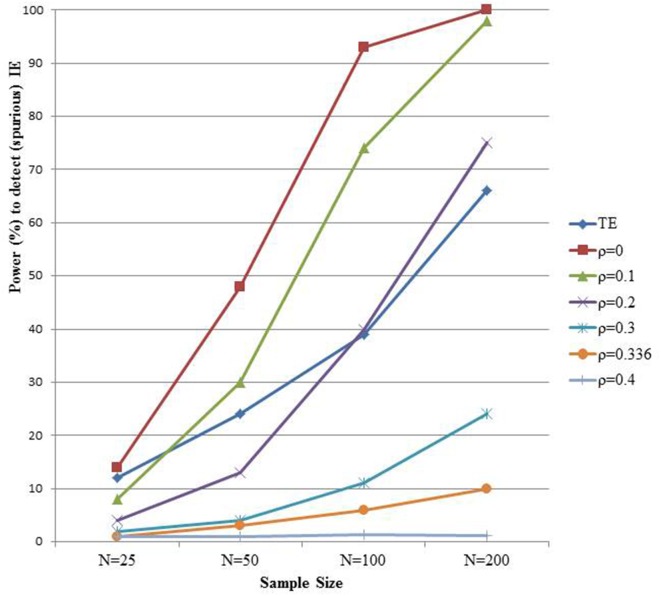
Figure 4.
The power to detect the indirect effect (IE). Data are generated according to the right panel of Figure 1 with a = 0.4 and c' = 0.16 and a residual correlation rho between M and Y equal to 0.336. The different power curves represent varying assumptions on unmeasured confounding of the M-Y relationship in a sensitivity analysis.

