Figure 1.

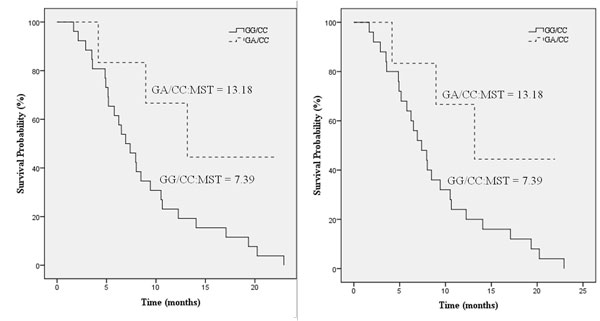
Kaplan Meier plots. (a) POLA2+1747 GG/GA and SLC28A2+65 CC, and (b) POLA2+1747 GG/GA and SLC28A2+225 CC showing the association of POLA2+1747 GG/GA with overall survival time.

Kaplan Meier plots. (a) POLA2+1747 GG/GA and SLC28A2+65 CC, and (b) POLA2+1747 GG/GA and SLC28A2+225 CC showing the association of POLA2+1747 GG/GA with overall survival time.