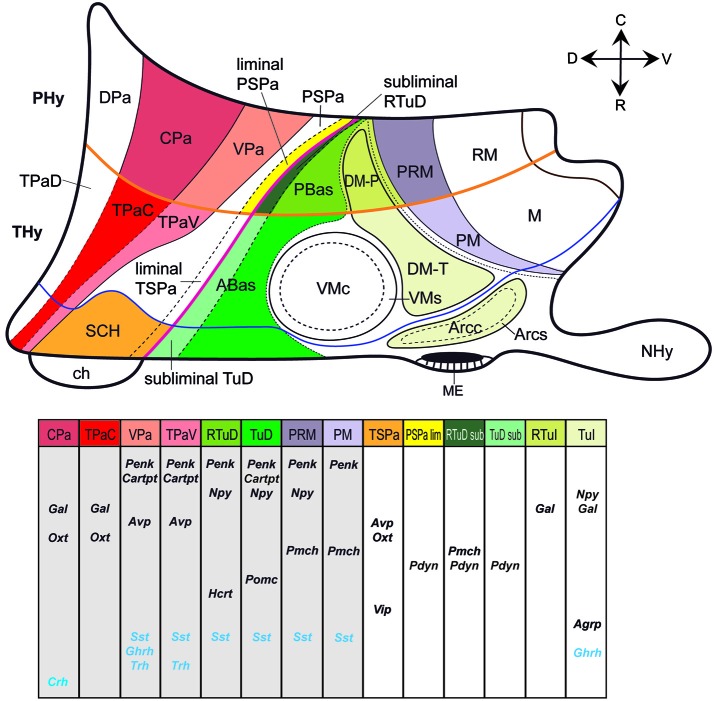
Figure 2.
Schematic color-coded prosomeric map illustrating the main prenatal and early postnatal progenitor areas where peptidergic cell populations originate in the mouse hypothalamus. Specific peptidergic transcripts generated at each source area are represented in tabular form; each column corresponds to a progenitor area identified by a color in the upper schema. For abbreviations, see the list.

