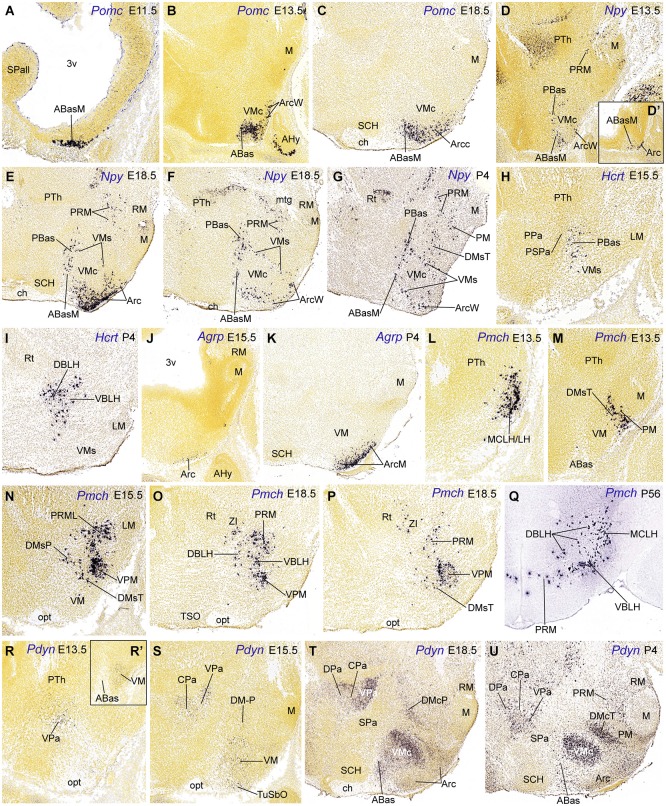
Figure 4.
Parasagittal (A–P, D’, R–U, R’) and transverse (Q) sections through the hypothalamus at embryonic and postnatal stages, showing relevant examples of the spatiotemporal expression of Pomc (A–C), Npy (D–G), Hcrt (H–I), Agrp (J–K), Pmch (M–Q) and Pdyn (R–U). All images were downloaded from the Allen Developing Mouse Brain Atlas.3 For abbreviations, see the list.

