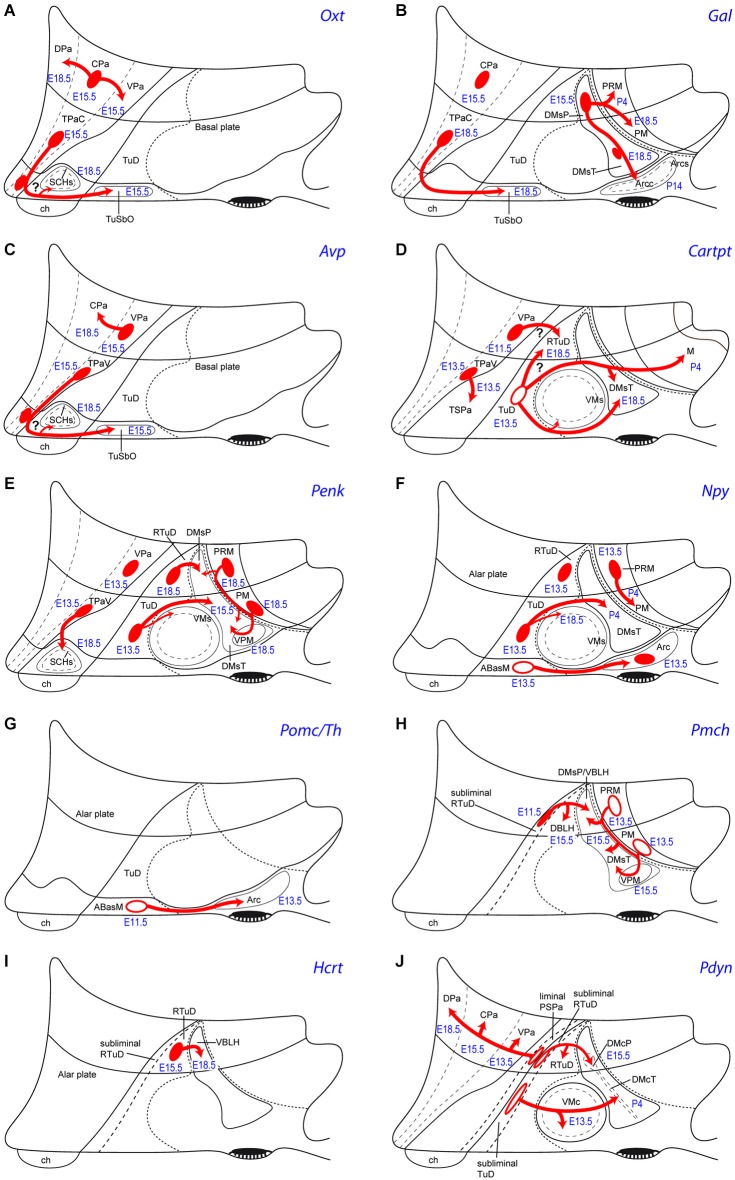
Figure 5.
Schemata of the apparent tangential migration routes (red arrows) of the Otx (A), Gal (B), Avp (C), Cartpt (D), Penk (E), Npy (F), Pomc/Th (G), Pmch (H), Hcrt (I) and Pdyn (J) cell populations, highlighting the source areas (red ovals) and the apparent recipient areas (named areas next to arrow tips). Uncertain postulated migrations are indicated with a question mark. Filled red ovals identify progenitor areas where the relevant peptidergic cells persist and accumulate radially (see manuscript for details). Empty red ovals mark instead the progenitor areas whose mapped peptidergic population entirely moves tangentially into the indicated recipient areas (devoid of the cell type in the adult). The schemata also show the recorded embryonic/postnatal stages of first appearance of a particular peptidergic population at its source, as well as at individual recipient areas. For abbreviations, see the list.

