
Figure 3.
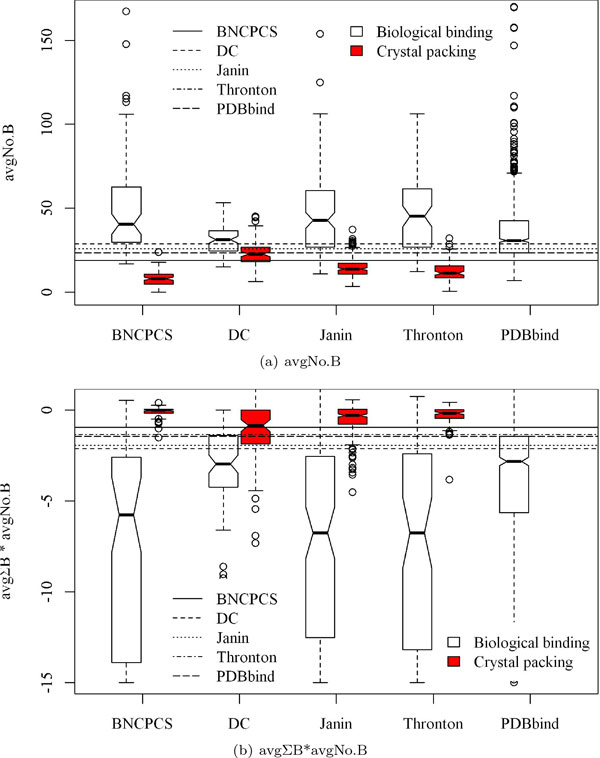
The score distributions of Average No.B (avgNo.B) and avgΣB*avgNo.B in boxplot for the five datasets. The p-values are shown in Table 2. The horizontal lines represent the best split points for each of the four datasets and the 25% quantile point on PDBbind. avgΣB*avgNo.B is divided by 100 for better visualization but without changing its value distribution between the two types of interfaces.