
Figure 4.
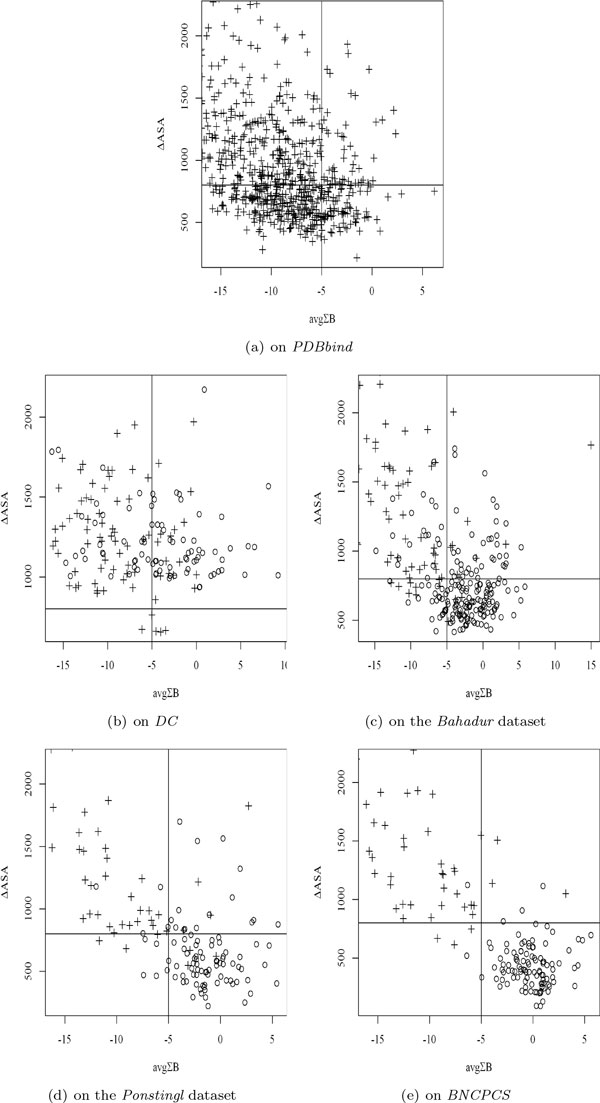
The relationship of ΔASA and avgΣB. Sign + represents a true binding interface, while ○ represents a crystal packing interface. Those complexes with ΔASA larger than 2200 Å or avgΣB smaller than -16 are all true binding and thus are not drawn. The horizontal lines have ΔASA = 800 Å, while the vertical lines have avgΣB = -5. Both the values are not optimized but used only for a better visualization of the different distribution across datasets.