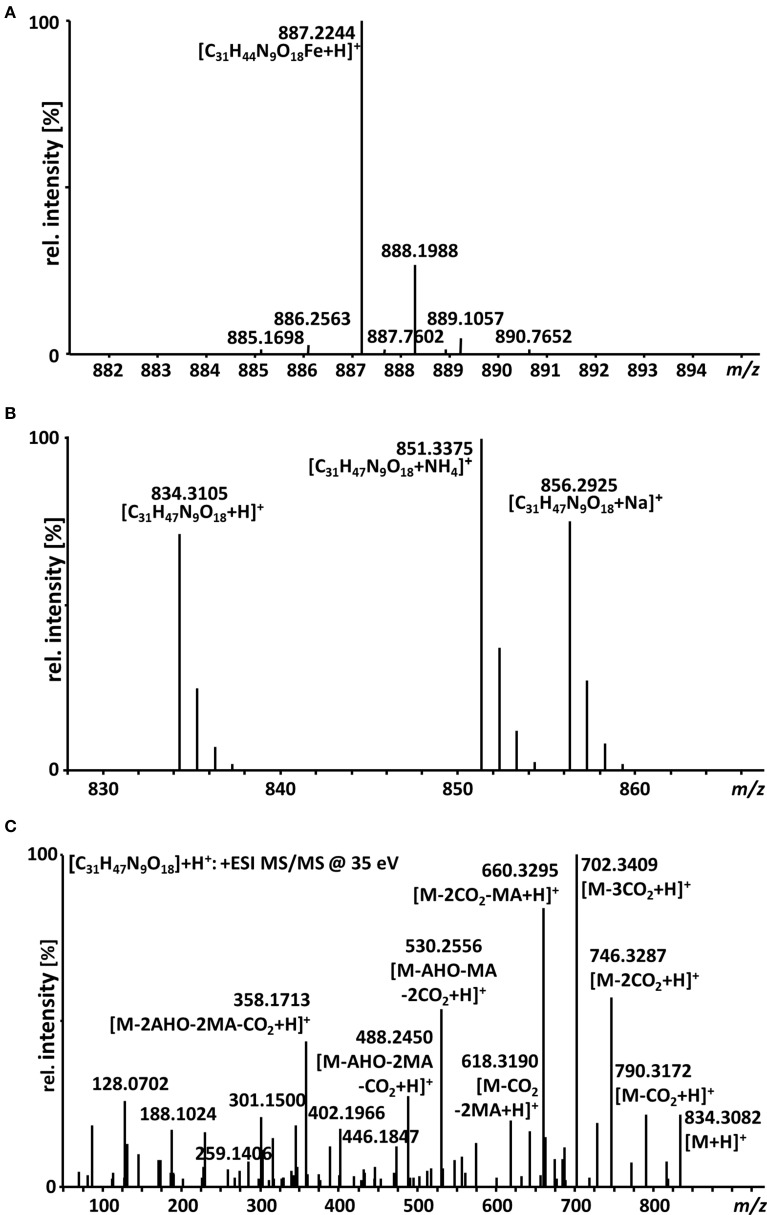
Figure 2.
LC-HR-MS spectra of malonichrome. (A) Isotope pattern of the [M+H]+ ion cluster of malonichrome (ferri-form). (B) LC-HR-MS spectrum of malonichrome (desferri-form), showing [M+H]+, [M+NH4]+ and [M+Na]+ ions. (C) LC-HR-MS/MS spectrum of malonichrome (desferri-form) at a collision energy of 35 eV.

