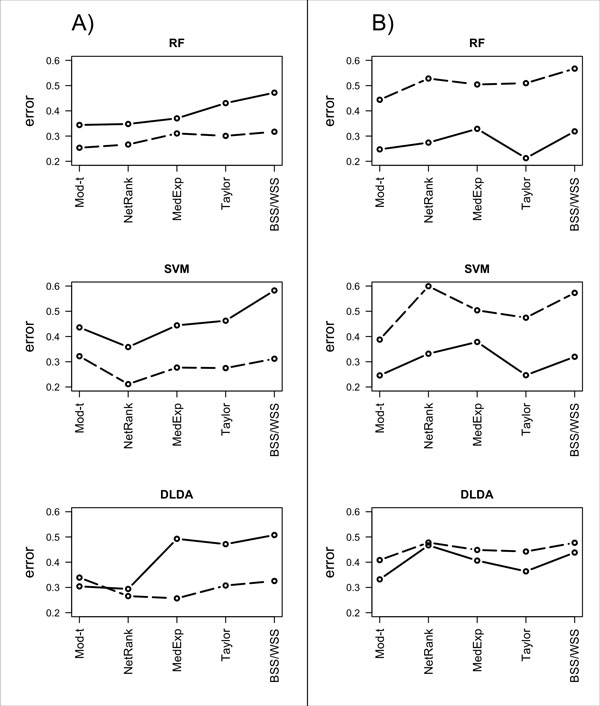
Figure 3.

Class-specific classification error rates. The GP (dotted line) and PP (solid line) error rates averaged over the 100 rounds of 5-fold cross validation for each method are presented for the iRefWeb network and the RF classifier, the SVM classifier and the DLDA classifier using A) the melanoma data set and B) the ovarian cancer data set.
