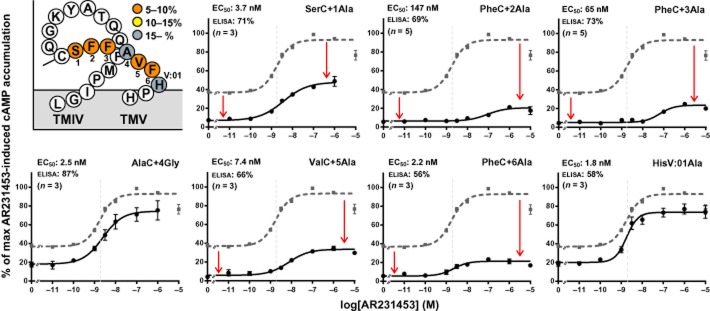
Figure 4.

Structural basis for the constitutive activity – ECL-2b. The graphs show normalized concentration–response curves for AR231453 on GPR119 receptors mutated in ECL-2b (black). On each graph, the wild-type curve is shown in stippled grey for comparison. The EC50 values are indicated in grey stippled lines and can also be found in the upper left corner of each graph together with the surface expression level of the mutant and number of repetitions. The figure on the upper left shows the ECL-2 of GPR119, colour coded for the level of constitutive activity obtained with the receptor mutants. The constitutive activity was calculated by setting the Emax for AR231453-induced activation of the wild-type receptor to 100 and the mean value from cells transfected with an empty vector to 0.
