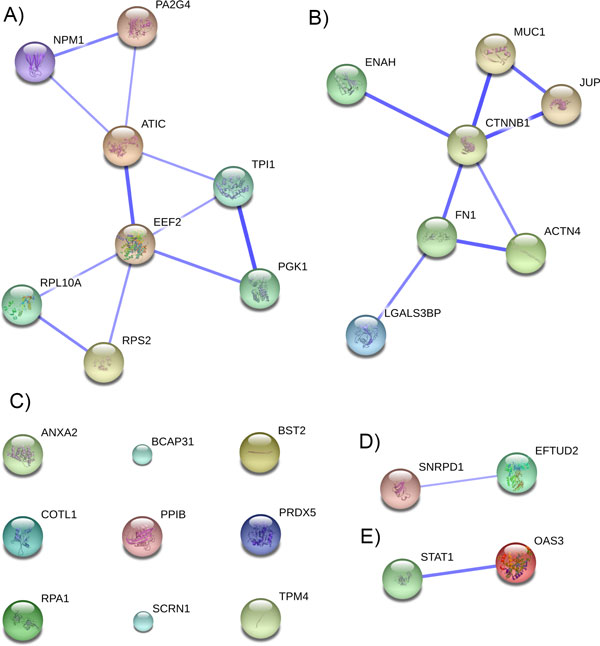
Figure 5.

Confidence view of protein-protein interactions within the 28 examined TAs, generated using STRING database. Nodes correspond to TAs and edges correspond to functional interactions. Thicker edges signify higher confidence in the interaction. Only interactions with a confidence score higher than 0.5 were included.
