
Figure 3.
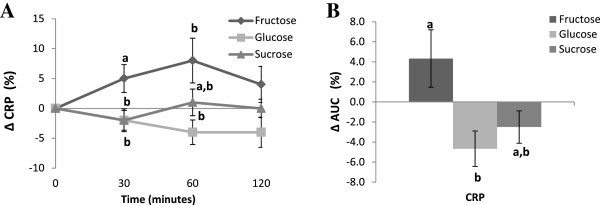
Kinetics of change (A) and area under the curve (AUC) (B) for CRP (mg/L) after the fructose, glucose or sucrose supplementations. Values without a common superscript are significantly different; P < 0.05.
Official websites use .gov
A
.gov website belongs to an official
government organization in the United States.
Secure .gov websites use HTTPS
A lock (
) or https:// means you've safely
connected to the .gov website. Share sensitive
information only on official, secure websites.
Kinetics of change (A) and area under the curve (AUC) (B) for CRP (mg/L) after the fructose, glucose or sucrose supplementations. Values without a common superscript are significantly different; P < 0.05.