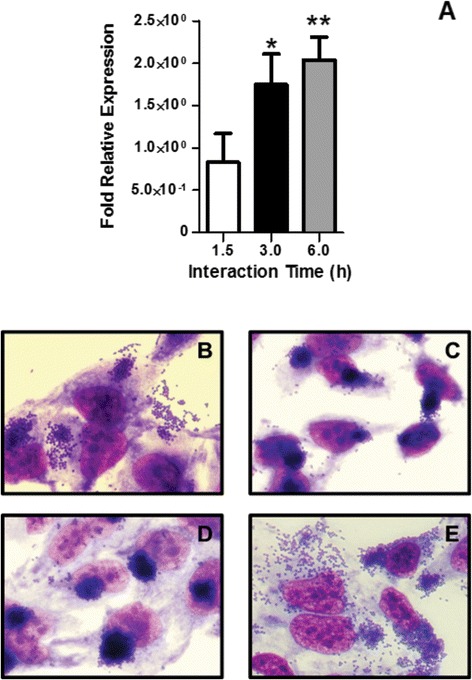
Figure 2.

The aggregative adherence-like pattern shown by aEPEC 1551–2 at high glucose concentration is dependent on type 1 pili production. (A) Relative expression of fimA in presence of 5 mM (calibrator) and 25 mM glucose at 1.5 h, 3 h and 6 h. The data showed that at 3 and 6 h, there was an increase in fimA expression of 75 ± 21% and 103 ± 15%, respectively. (B, C, D and E) Adherence patterns observed with the wild-type strain (B), 1551-2ΔfimA (C), 1551-2ΔfimA (pBAD) (D) and 1551-2ΔfimA (pFimA) (E). The 1551-2ΔfimA mutant maintained the LA pattern on HeLa cells, but the AA-like pattern was no longer observed, pointing to the involvement of T1P in the establishment of this phenotype. * and ** indicate statistical differences observed between experiments performed at 5 and 25 mM glucose after 3 h (P =0.02) and 6 h (P =0.002) of incubation, respectively.
