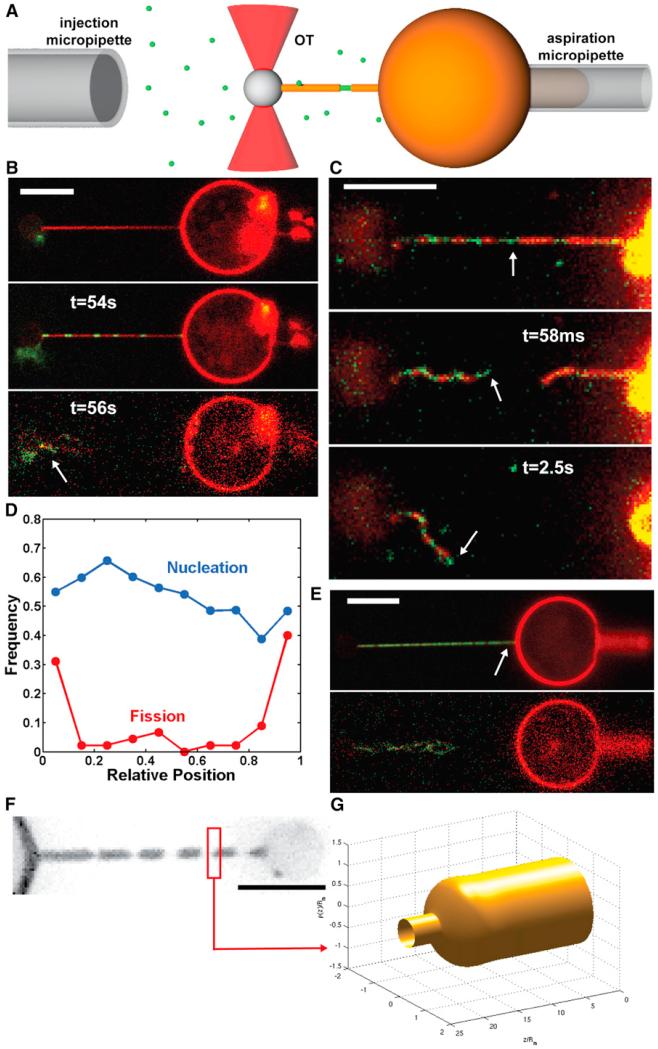
Figure 1. Localization of Fission Events at Dynamin-Membrane Edges.
(A) Schematic drawing of the experimental set-up. A micropipette (right) set the GUV’s tension. A membrane nanotube is extracted from the GUV via a microbead trapped in optical tweezers (red cones). A second micropipette (left) injects locally dynamin and GTP.
(B) Confocal pictures of a GUV labeled with BodipyTMR-PI(4,5)P2 (red channel) and dynamin labeled with Alexa 488 (green channel); see also Movie S1. Top: Membrane nanotube before injection of dynamin + GTP. Middle: Nanotube partially coated with dynamin after injection of dynamin + GTP. Bottom: Fission 56 s after start of polymerization. Remaining tube is still attached to the bead (white arrow). Scale bars, 5 μm.
(C) Images from dual-color spinning disk confocal microscopy. Top: tube before fission. Middle: Same tube 58 ms after fission. Bottom: Same tube 2.5 s after fission. After fission, extremity of the left stump is covered with green dynamin, whereas the right stump is uncoated, showing that fission occurred at the edge between a seed of dynamin (white arrows) and the dynamin-free membrane nanotube (see also Figure S1 and Movie S2). Scale bars, 5 μm.
(D) Frequency of dynamin nucleation (blue) and fission (red) along the nanotube. Position is normalized so that 0 and 1 are, respectively, the bead boundary and the connection between the tube and the GUV. N = 44 tubes.
(E) Confocal pictures of a GUV and a dynamin-coated nanotube as shown in (B) (see also Movie S3). Nothing remaining of the tube is seen on the GUV, showing that fission occurred at the connection between the tube and the GUV (white arrow). Scale bars, 5 μm.
(F) Fluorescence image of a membrane tube constricted by dynamin in presence of GTP (TMRPE). Scale bars, 5 μm.
(G) Calculated shape a single dynamin-membrane edge by simulations.

