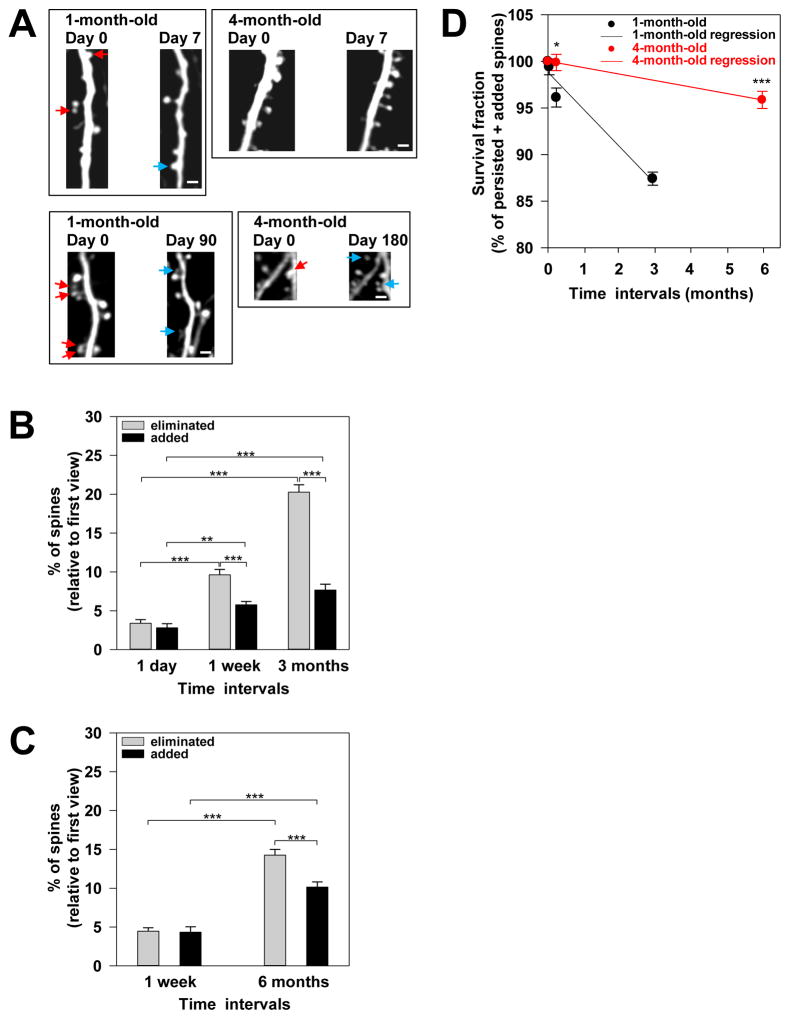
Figure 2. Long-term in vivo imaging studies revealed a nearly 6-fold decrease in the rate of net spine loss within cortical circuits in maturity.
(A) Photomicrographs from repeated live imaging of YFP-labeled apical dendritic segments through a thinned-skull cranial viewing window. The red arrows indicate spines that were eliminated over one week (top two panels) and over several months (bottom two panels), respectively, in 1-month-old and 4-month-old mice. The blue arrows indicate new spine that were added over time. Shown are laterally projecting spines on the dendritic segments. Scale bars, 2 μm.
(B and C) Shown are the percentages of eliminated (gray bars) and added (black bars) spines over the indicated time intervals in 1-month-old (B) and 4-month-old
(C) mice. Statistical analysis was performed using One-Way ANOVA with the Holm-Sidak method for pair-wise multiple comparison. ** denotes p = 0.012 and *** denotes p ≤ 0.001. Data are presented as the mean ± s.e.m.
(D) Survival fractions in 1-month-old (black) animals after one day, one week, and 3 months are shown. In addition, the survival fractions in 4-month-old (red) mice after one week and 6 months are shown. The survival fraction at Day 0 is set at 100%. Regression lines from linear regression analyses are shown for 1-month-old (black, slope= 3.99% per month) and 4-month-old (red, slope= 0.69% per month) animals. Statistical analysis was performed using the Mann-Whitney Rank Sum test. * denotes p ≤ 0.05) and *** denotes p ≤ 0.001. Results are presented as the mean ± s.e.m.

