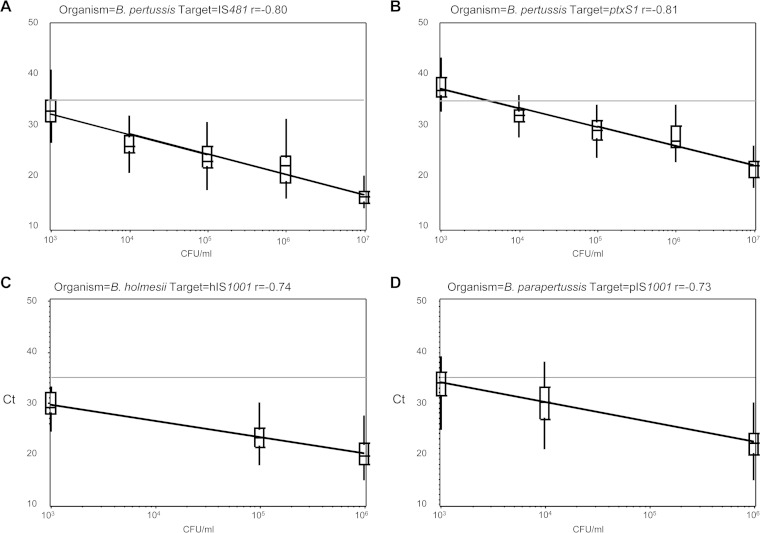
FIG 1.
Correlation of cycle threshold (CT) values with sample concentrations for four real-time PCR targets, combining results from the spring and fall performance panels. Pearson's correlation coefficient (r) is shown above each plot. (A) Eight B. pertussis samples, IS481 target (n = 386). (B) Eight B. pertussis samples, ptxS1 target (n = 177). (C) Six B. holmesii samples, hIS1001 target (n = 147). (D) Six B. parapertussis samples, pIS1001 target (n = 198). Each horizontal line indicates the positive cutoff value for IS481 in the CDC multitarget assay (CT < 35).

