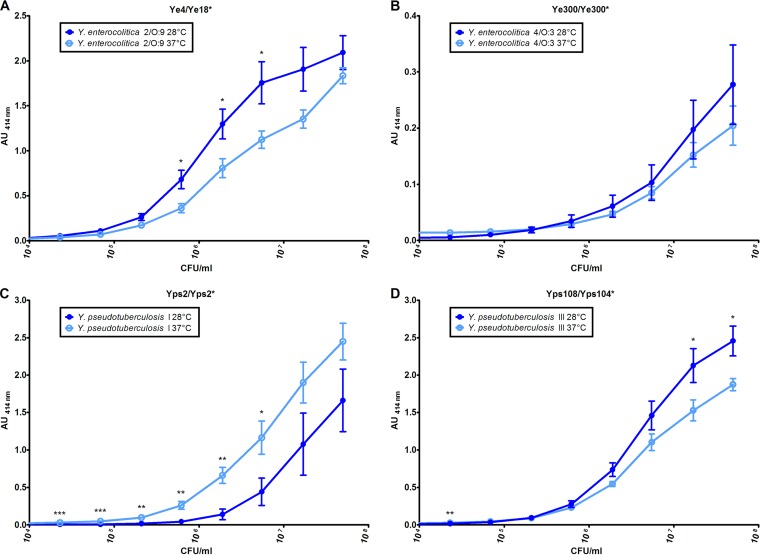
FIG 2.
Impact of the growth temperature on detection of Yersinia by optimized enzyme immunoassays. Yersinia species were grown at 28°C (dark-blue curve) and 37°C (light-blue curve), and 10-fold serial dilutions were performed before a 3-h incubation. (A) EIA Ye4/Ye18* for detection of Y. enterocolitica 2/O:9. (B) EIA Ye300/Ye300* for detection of Y. enterocolitica 4/O:3. (C) EIA using Yps2/Yps2* for detection of Y. pseudotuberculosis I. (D) EIA using Yps108/Yps104* for detection of Y. pseudotuberculosis III. Asterisks indicate values that are significantly different. *, P < 0.05; **, P < 0.01; and ***, P < 0.001 (for comparisons between signals).

