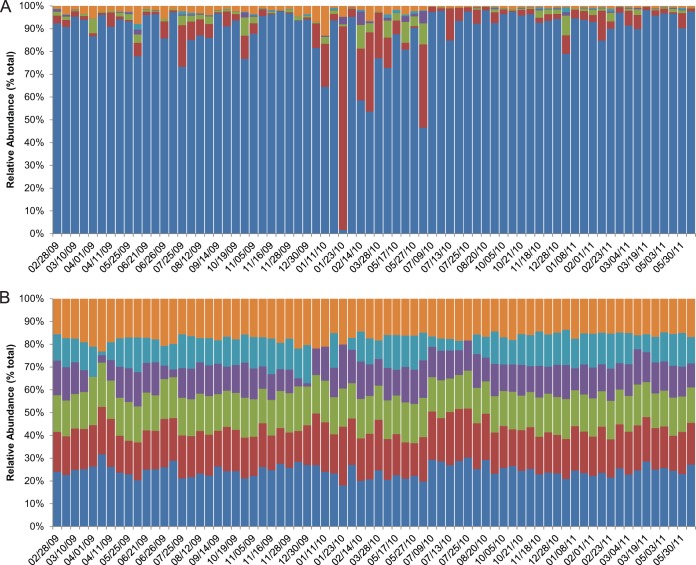
FIG 3.
Change in relative abundance of taxa classified to the family level during the sampling period. The families in the top five of relative abundance are shown (dark blue, Pseudomonadaceae; red, Burkholderiaceae; purple, Streptococcaceae; purple, Micrococcaceae; light blue, Veillonellaceae). The relative abundances of all other families, each representing <0.5% of the community, are grouped in the “other” (orange) category. The colored bars represent the proportion of (unlogged [A], log10 [B]) reads mapped to each family. The dates on the x axis are in month/day/year format.

