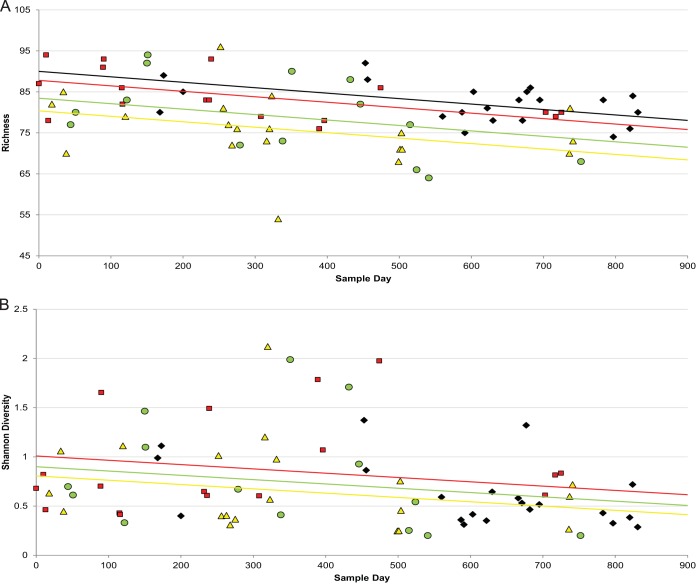
FIG 4.
The changes in bacterial richness (A) and bacterial diversity (B) from 72 sputum samples are shown over time. Richness (P = 0.018) and diversity (P < 0.050) decreased significantly over the sampling period. Richness but not diversity showed a significant (P = 6.59e−05) decrease during treatment for a PE compared to those variables in the stable time period. The time points are plotted as before treatment (red squares) (≤30 days before an exacerbation), treatment (yellow triangles) (samples collected during and within 48 h of termination of treatment), recovery (green circles) (≤30 days after an exacerbation), and stable (black diamonds) (>30 days prior to or after an exacerbation). (B) The best fit line for the stable time period is superimposed with the line for recovery due to their similarity. The best fit lines are red for before treatment, yellow for treatment, green for recovery, and black for stable.

