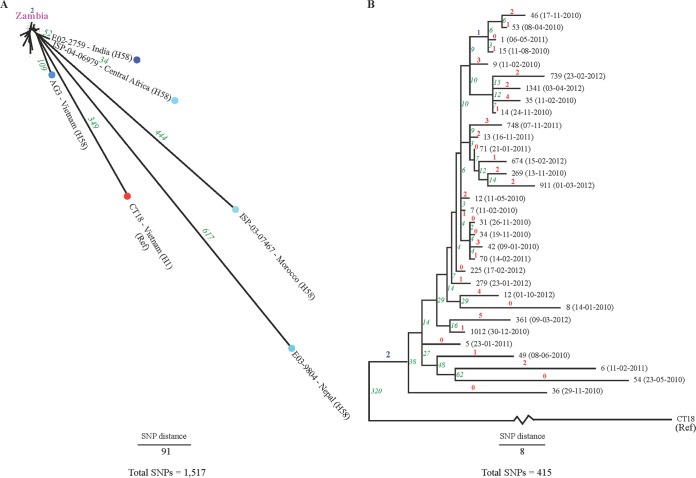
FIG 4.
Phylogenetic reconstruction of the evolutionary relationships among the Salmonella serovar Typhi genomes from Zambia. Numbers marked in red indicate autapomorphic SNPs (for Fig. 4B), those in blue indicate synapomorphic SNPs, and those in green indicate the total SNP difference between isolates. In panel A, the genomes belonging to H58B var. from Zambia are marked in pink.

