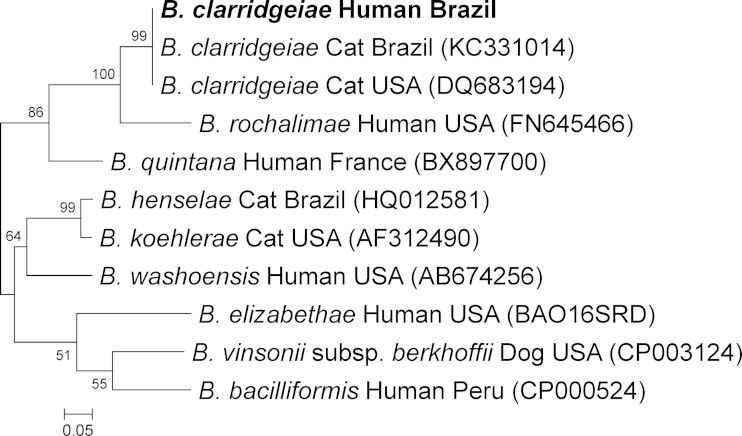
FIG 1.
Phylogenetic tree based on 136 bp from the 16S-23S rRNA intergenic transcribed spacer (ITS) sequences of Bartonella clarridgeiae obtained from a blood donor (in boldface) and closely related organisms constructed by using the maximum-likelihood method on the basis of the Kimura 2-parameter model. Each bacterial name is followed by isolation source and geographic-origin data, and the GenBank accession number is provided in parentheses. The numbers at the nodes indicate percentages of bootstrap support based on 1,000 replicates. Percentages corresponding to partitions reproduced in fewer than 50% of bootstrap replicates are collapsed. The scale bar indicates 0.05 substitutions per nucleotide position.

