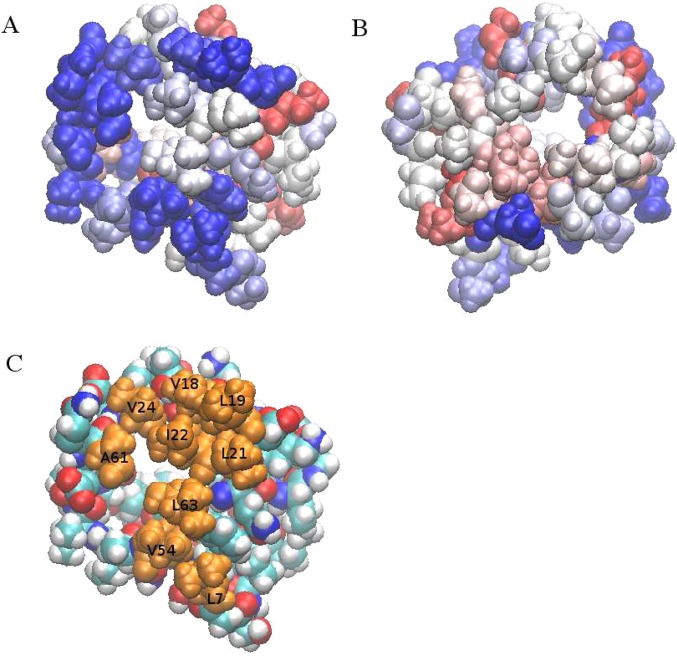
Figure 10.
(A) Gdm+ number density map around HFBII protein (hydrophobic side). Blue represents higher number density, while red represents lower number density. (B) Gdm+ number density map around HFBII protein (opposite side). (C) Representation of hydrophobic protein patch of HFBII with orange highlighting each hydrophobic residue on the patch.

