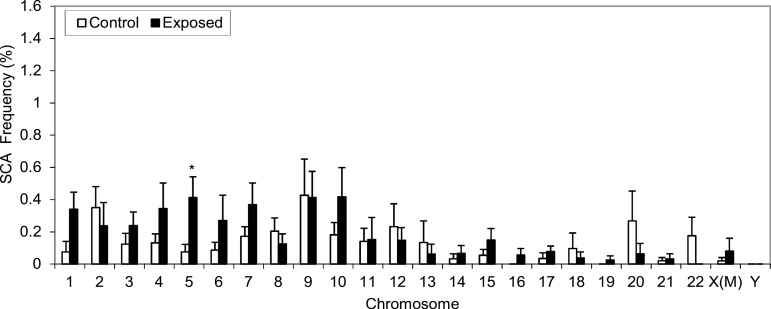
Fig. 2.
Mean frequencies of total structural chromosome aberration (SCA) for all 24 chromosomes in workers exposed to formaldehyde and unexposed controls. Mean unadjusted frequency and standard errors of total SCA for all 24 chromosomes in unexposed controls (n = 23) and exposed workers (n = 29) are shown. P-values are from models adjusted for covariates shown in table 5. The P-value indicating significance of the increase relative to controls is denoted as *<0.05. X(M) represents X chromosome in males.

