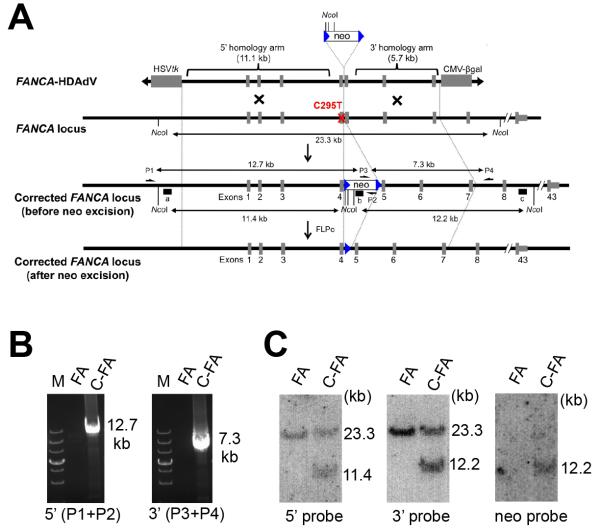
Fig. 4. Gene correction of FA-specific iPSCs.
A, Schematic representation of HDAdV-based correction of the C295T mutation at the FANCA locus. The HDAd-vector includes a neomycin-resistant cassette (neo) and an HSVtk cassette to allow for positive and negative selection, respectively. Half arrows indicate primer sites for PCR (P1, P2, P3 and P4). Probes for Southern analysis are shown as black bars (a, 5′ probe; b, neo probe; c, 3′ probe). The red X indicates the mutation site in exon 4. Blue triangles indicate the FLPo recognition target (FRT) site. B, PCR analysis of FA-iPSCs (FA) and gene corrected FA-iPSCs (C-FA) using 5′ primer pair (P1 and P2; 12.7 kb) or 3′ primer pair (P3 and P4; 7.3 kb). M, DNA ladder. C, Southern blot analysis. The approximate molecular weights (kb) corresponding to the bands are indicated.

