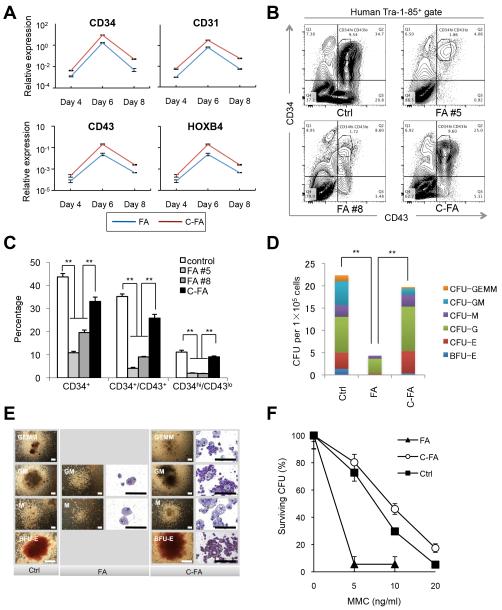
Fig. 5. Hematopoietic differentiation of FA-iPSCs and characterization of FA-iPSC-derived HPCs.
FA-iPSCs were differentiated by using a murine OP9 stromal cell-based differentiation protocol that allows robust generation of hematopoietic cells for downstream quantitative analyses. A, RT-qPCR analysis of the kinetics of the upregulation of hematopoietic lineage specific marker genes during hematopoietic differentiation of FA-iPSCs (FA) and FA-iPSCs corrected by HR (C-FA). Expression levels are normalized against GAPDH. Data are shown as mean±s. e.m. n=3. B, FACS analysis of the CD34+ and CD43+ populations 13 days after hematopoietic differentiation of control iPSCs, FA-iPSCs (#5 and #8 clones) and C-FA-iPSCs. Cells shown are in the Tra-1-85+ gate, which shows only human cells. Numbers represent percentages. C, Percentage of differentiated iPSCs that are CD34+(Q1 & Q2 in B), CD34+/CD43+ (Q2 in B) and CD34hi/CD43lo (small gate in Q2 in B). Error bars represent SEM of 3 independent experiments. ** p<0.01 (t-test). D-E, Colony forming assays of human iPSC-derived hematopoietic progenitors harvested after 14 days of differentiation. Data are representative results from two independent experiments. Quantification of the indicated colony types derived from a total of 1×10⁵ starting differentiated cells. CFU-GEMM, colony-forming unit granulocyte/erythroid/macrophage/megakaryocyte; CFU-GM, colony-forming unit granulocyte/monocyte; CFU-M, colony-forming unit macrophage; CFU-G, colony-forming unit granulocyte; CFU-E, colony-forming unit erythroid; BFU-E, blast-forming unit erythroid. n=3. ** p<0.01 (t-test). (D). Representative photos of colony morphology (left columns) and Wright staining of cytospins (right columns) of different hematopoietic colonies are shown (E). Scale bar, 300 μm. F, MMC sensitivity of Ctrl-iPSC-, FA-iPSC- and C-FA-iPSC-derived blood lineage colonies. Data are shown as mean±s.d. n=4.

