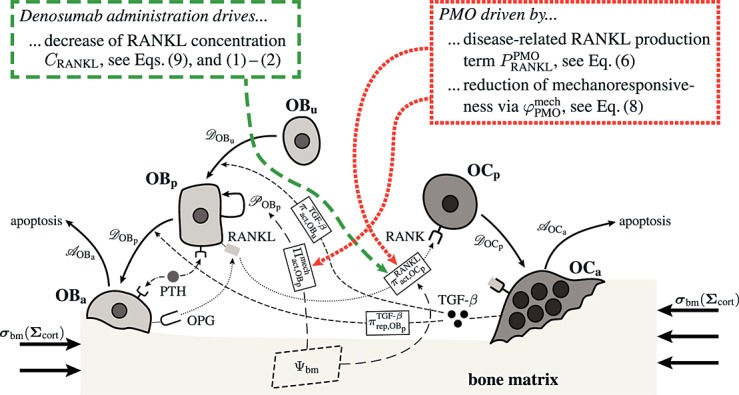
Figure 3.

Graphical sketch, adapted from Pivonka et al. 33, showing all mechanisms considered in the model presented in this paper, with novel contributions colored green and red: guidance of cell developments (OBu → OBp → OBa and OCp → OCa) occurs biochemically (governed by TGF-β and the RANK-RANKL-OPG pathway, including the action of PTH) via related activator and repressor functions, πact and πrep, and biomechanically (the macroscopic loading Σ relates to microscopic loading σbm, causing microscopic deformations represented by the microscopic strain energy density Ψbm, the latter entering the bone cell population model); evolutions of the different cell developmental stages follows cell differentiation (considered through maximum differentiation rates  ,
,  , and
, and  ), cell proliferation (considered through maximum proliferation rate
  ), and cell apoptosis (considered through maximum apoptosis rates
  and
and  ); the mechanisms based on which the effects of PMO and denosumab administration, respectively, are depicted in the red-colored box (dotted thick lines) and in the green-colored box (dashed thick lines), respectively; see Sections 3.2–3.4 for details on related model extensions.
