
Figure 6.
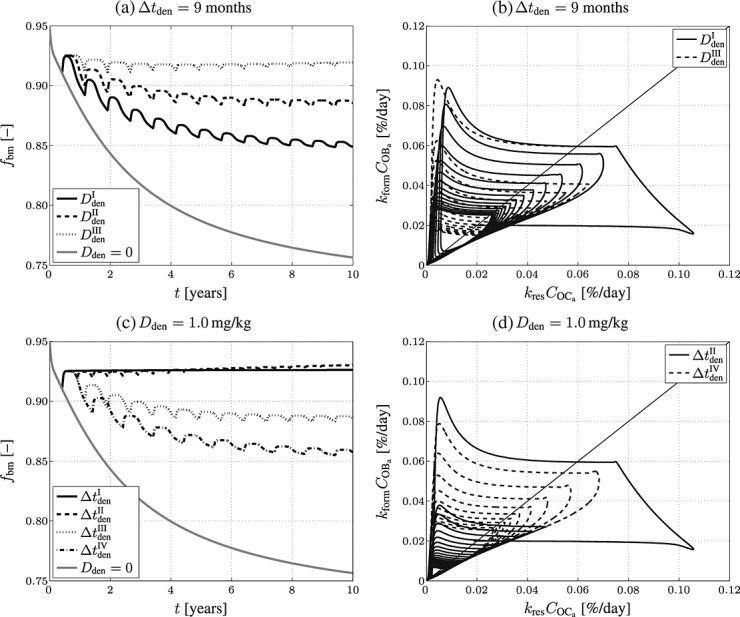
Simulation results obtained for administration regimes involving multiple administrations of denosumab: temporal evolutions of volume fractions of the extravascular bone matrix, fbm, during progression of PMO (a) for different administered doses ( mg/kg,
  mg/kg, and
  mg/kg) and (c) different administration intervals (
 month,
  months,
  months, and
  months), as well as the corresponding phase diagrams (b) and (d), where each loop corresponds to one of the “hills” in (a) and (c), representing one administration interval; the paths depicted in (b) and (d) are directed counterclockwise.