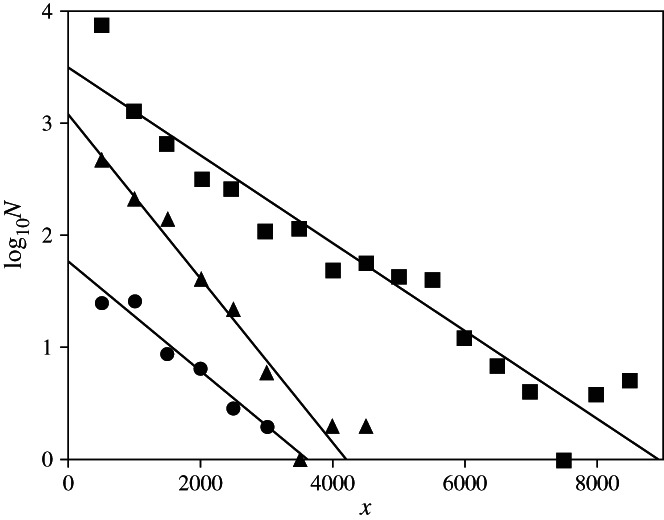
Fig 1.

The relationship between log10N (N = number of species within a 500 m depth stratum) and depth (x) for three classes of fishes with fitted regression lines: Myxini ( ) log10N = −0·000488x + 1·760000 (r2 = 0·965), Chondricthyes (
 ) log10N = −0·000731x + 3·070000 (r2 = 0·954) and Actinopterygii (
 ) log10N = −0·000413x + 3·550000 (r2 = 0·944).
