
Figure 1. Tissue expression pattern of IL-22BP in the rat.
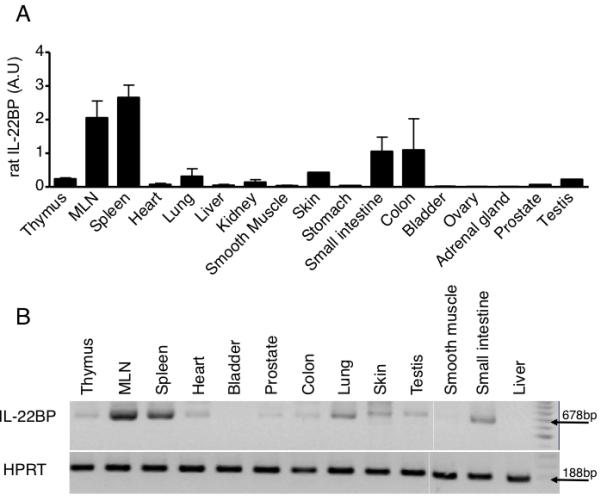
(A) IL-22BP gene expression was analyzed by RT-qPCR. Bars represent the mean ± SEM ratio of IL-22BP gene to HPRT expression as determined by the 2-ΔΔCt method of relative quantification from 2 experiments. (B) IL-22BP gene expression was analyzed by RT-PCR using primers allowing amplification of whole il22ra2 mRNA. Values indicate expected molecular mass of PCR products. Data are representative of two independent experiments.