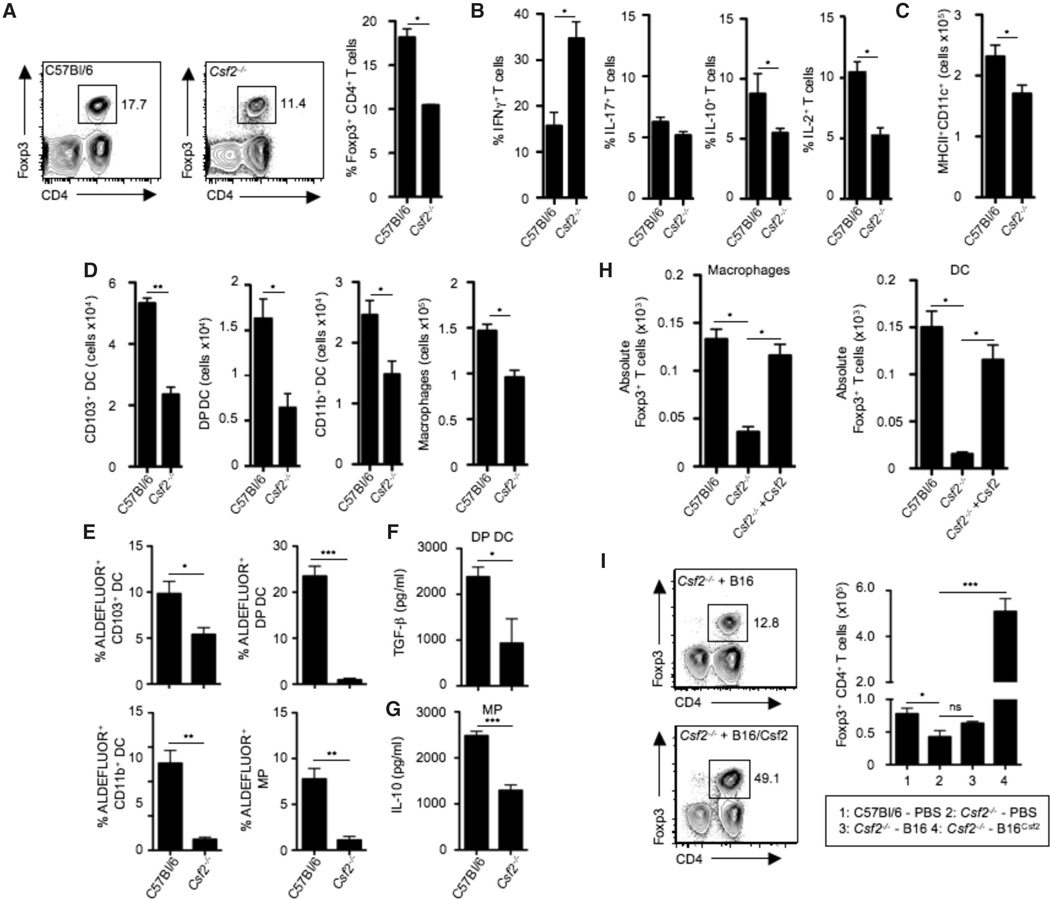
Fig. 1. Csf2 regulates tissue mononuclear phagocyte frequency and effector functions required for T helper cell homeostasis.
(A) Contour plots and bar graph show percentages of CD3+CD4+Foxp3+ colonic Tregs among total colonic lamina propria CD45+ cells in C57Bl/6 and Csf2−/− mice. (B) Bar graphs show percentages of CD3+CD4+ T cells producing IFN-γ, IL-17, IL-10, or IL-2 among total colonic CD45+ cells in C57Bl/6 and Csf2−/− mice after 4 hours of stimulation with phorbol 12-myristate 13-acetate (PMA)–ionomycin in the presence of Brefeldin A. (C) Bar graphs show absolute numbers of MHCII+CD11c+ cells among total colonic CD45+ cells in C57Bl/6 and Csf2−/− mice. (D) DCs were characterized as CD45+MHCII+CD11c+ and further subdivided into CD103+ DCs, CD103+CD11b+ DCs [double positive (DP) DCs], and CD11b+ DCs. Macrophages (MP) were characterized as MHCII+CD11c+CD11b+F4/80+CD64+ cells. Bar graphs show absolute numbers of CD103+ DCs, DP DCs, CD11b+ DCs, and MPs in C57Bl/6 and Csf2−/− mice. (E) Percentages of ALDEFLUOR+ cells among each colonic DC subset and MPs in C57Bl/6 and Csf2−/− mice. (F and G) Bar graphs show enzyme-linked immunosorbent assay (ELISA) measurement of TGF-β production by sorted DP DCs (F) and IL-10 production by sorted MPs (G). (H) Colonic MPs or DCs were FACS-sorted from C57BI/6 or Csf2−/− mice and cocultured with naïve T cells alone or in the presence of exogenous Csf2. Bar graphs show absolute numbers of Foxp3+ Tregs. Data are representative of six independent experiments and are shown as mean ± SD. (I) Contour plots show percentages of CD45+CD3+CD4+Foxp3+ colonic Tregs in Csf2−/− mice 12 to 14 days after injection with B16 melanoma cells or B16 cells overexpressing Csf2 (B16Csf2). Bar graphs show absolute number of colonic Tregs in the indicated groups. All data (A to H) are shown as mean ± SD of three independent experiment with at least three mice per experiment. Student’s t test (A to F) and one-way analysis of variance (ANOVA) Bonferroni’s multiple comparison test (H and I) were performed. Statistical significance is indicated by *P < 0.05, **P < 0.01, ***P < 0.001; ns, not significant.

