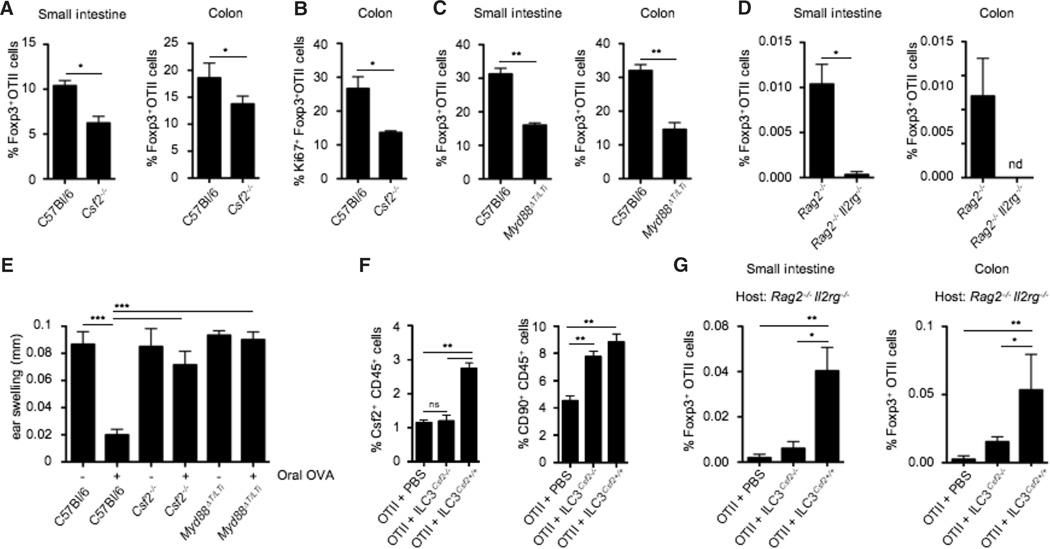
Fig. 4. ILC3-derived Csf2 controls oral tolerance to dietary antigens.
(A) Naïve OTII Rag2−/− CD45.1+ T cells were adoptively transferred into CD45.2+ C57Bl/6 and CD45.2+ Csf2−/− mice. Bar graph shows percentages of small intestinal and colonic OTII-specific Foxp3+ Tregs after oral feeding with OVA ad libidum. Data are shown as mean ± SD of three independent experiments with three mice per group. (B) Bar graph shows percentages of Ki67+ colonic Foxp3+ OTII T cells in C57Bl/6 and Csf2−/− mice after OVA feeding. Data are shown as mean ± SD of three independent experiments with three mice per experiment. (C and D) Naïve OTII Rag2−/− CD45.1+ T cells were adoptively transferred into C57Bl/6 and Myd88ΔT/LTi mice (C), or Rag2−/− and Rag2−/−Il2rg−/− mice (D). Bar graphs show percentages of small intestinal and colonic OTII-specific Foxp3+ Tregs after OVA feeding. Data are shown as mean ± SD of three independent experiments with three mice per group. (E) Csf2−/−, Myd88ΔT/LTi and control mice were either fed (+) or not fed with OVA (–) for 7 days to induce oral tolerance. Four days later, fed mice were immunized subcutaneously with OVA (300 µg) and complete Freund’s adjuvant and rechallenged 14 days later with OVA (50 µg) into the right ear, as described in the materials and methods. Skin DTH response was determined by ear swelling (mm). Data are shown as mean ± SD (n = 10 mice) and are representative of two independent experiments. (F and G) Purified wild-type or Csf2−/− ILC3 were injected into Rag2−/−Il2rg−/−hosts, 2 weeks before injection of naïve OTII CD45.1+ T cells. Reconstituted hosts were fed with OVA and analyzed 5 days later. (F) Bar graph shows percentages of Csf2+ CD45+ cells (left) and total CD90+ CD45+ ILCs (right) in the colonic lamina propria of the indicated host mice. Data are shown as mean ± SD of two independent experiments with three mice per group. (G) Bar graphs show percentages of small intestinal and colonic OTII-specific Foxp3+ Tregs after OVA feeding. Data are shown as mean ± SD of two independent experiments with three mice per group. Student’s t test (A to D) or one-way ANOVA Bonferroni’s multiple comparison test (E to G) were performed. Statistical significance is indicated by *P < 0.05, **P < 0.01, and ***P < 0.001.

