FIGURE 2.
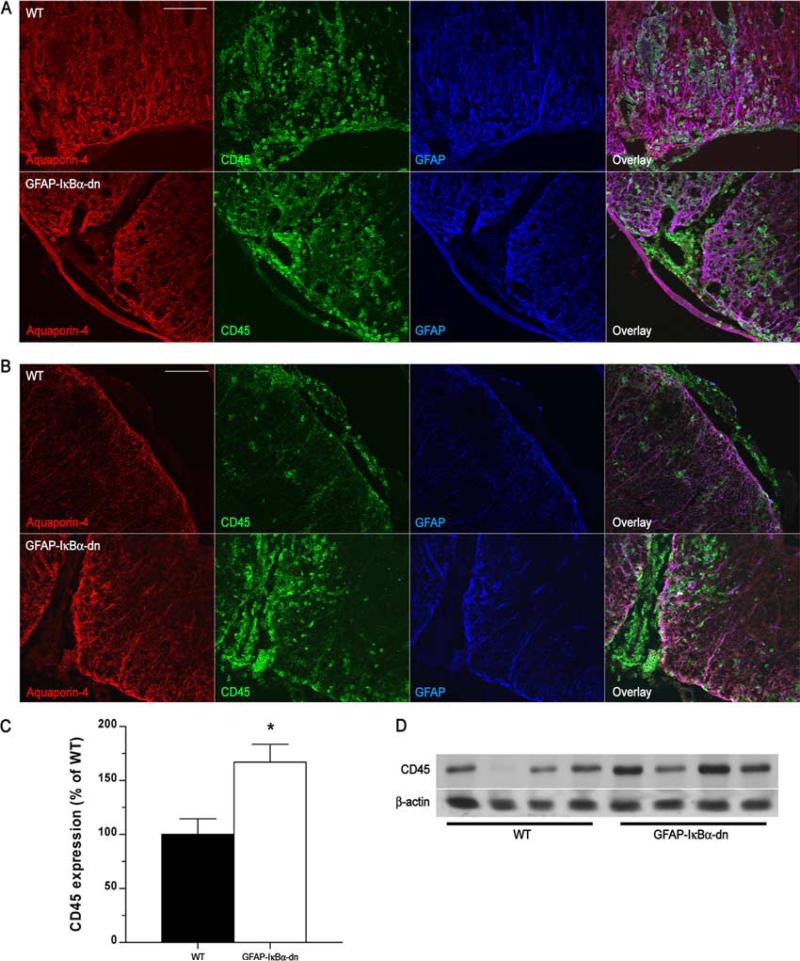
Leukocyte infiltration in WT and GFAP-IκBα-dn spinal cords following EAE. A, Immunofluorescent labeling of WT and GFAP-IκBα-dn tissue sections at 20 dpi (acute disease). B, Immunofluorescent labeling of WT and GFAP-IκBα-dn tissue sections at 40 dpi (chronic disease). Red: Aquaporin-4 (localized to astrocyte end-feet in contact with the vascular endothelium). Green: pan-leukocyte marker CD45. Blue: astrocyte-specific marker GFAP. Scale bar: 100 μm. C, Quantification of CD45 protein expression in spinal cord tissue of WT and GFAP-IκBα-dn mice at 40 dpi. Data are normalized to β-actin. Results represent the mean ± SEM of six animals/group and are expressed as percentage of WT. *, p < 0.05; Student's t test. D, Representative Western blot probed for CD45 and β-actin as loading control.

