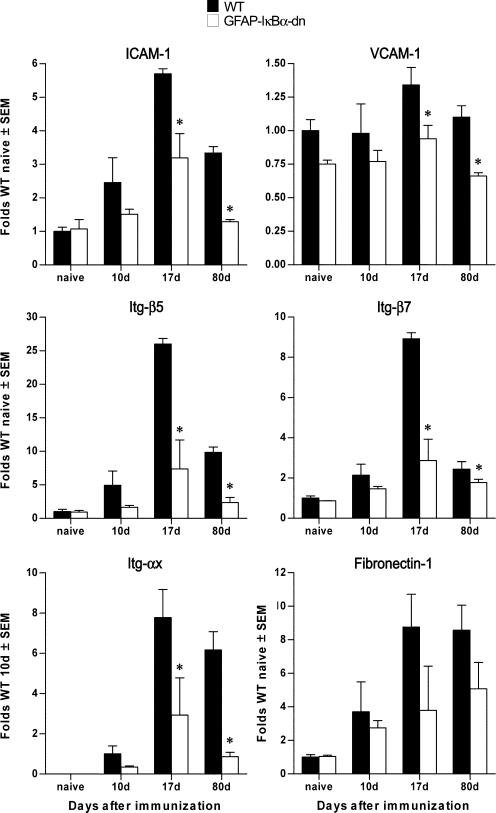
FIGURE 6.
Differential expression of adhesion molecules and Itg in WT and GFAP-IκBα-dn mice following EAE. Gene expression was assessed in naive animals and at 10, 17, and 80 dpi. For each gene, results are expressed as folds of corresponding WT naive ± SEM after normalization to β-actin. Four animals/group/time were analyzed. *, p < 0.05 with respect to corresponding WT; one-way ANOVA, Tukey test.

