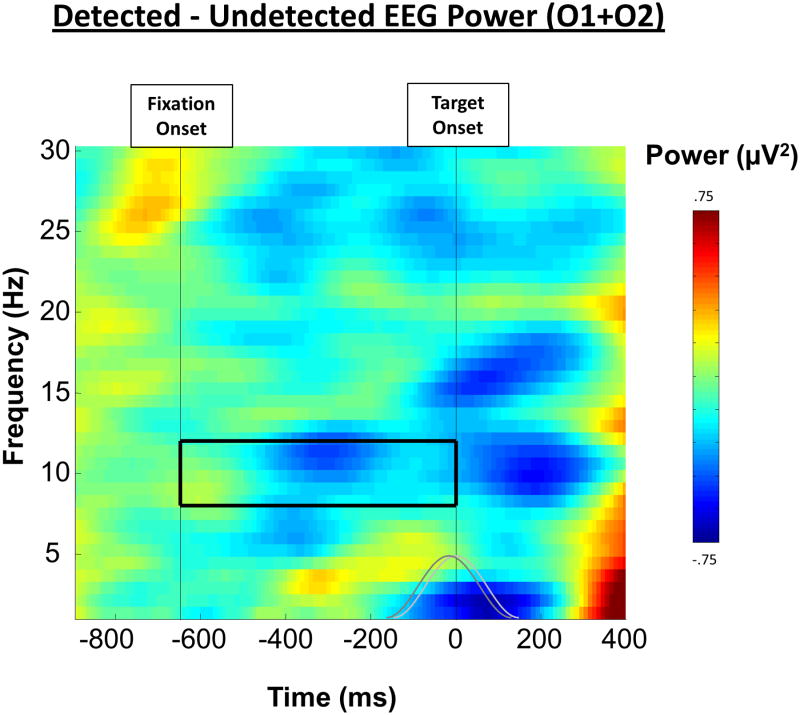
Figure 3.
EEG Alpha. The event-related spectral power for detected targets subtracted from that for undetected targets revealed a significant difference in 8-12 Hz EEG alpha oscillations between 200 and 400 ms prior to the onset of the target. Shown is this difference over frequency and time, averaged together from the two occipital electrodes (O1 and O2). The grey lines represent the size, shape, and overlap of the moving Hamming window FFT used to compute the data and the solid box represents the 8-12 Hz window of interest used for analysis.

