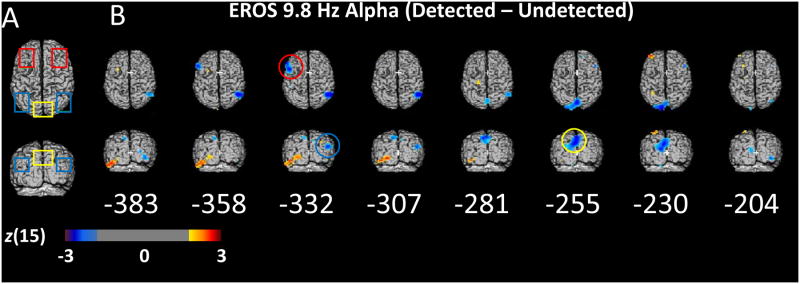
Figure 4.

EROS Alpha. (A) Two-dimensional projections of bilateral frontal (red), bilateral inferior parietal (blue), and cuneus (yellow) ROIs. (B) Statistical parametric maps of the Z-score difference between detected and undetected targets (detected – undetected) in 9.8 Hz phase-locked EROS alpha power for each 25.6 ms interval of the 400-200 ms prior to the onset of the masked target. The difference in phase-locked EROS alpha is shown projected orthogonally onto a common template of the superior axial (top) and posterior coronal (bottom) surfaces of a brain in Talairach space. Only Z scores greater than 2 or less than -2 are plotted for visualization purposes representing a one-sided threshold of α ≤ .0275, uncorrected for multiple comparisons. Colored circles represent the time and location at which a significant difference in phase-locked EROS alpha power peaked in the color-corresponding ROI shown in A, corrected within each ROI for multiple comparisons with random field theory. Each time point and ROI were tested independently.
