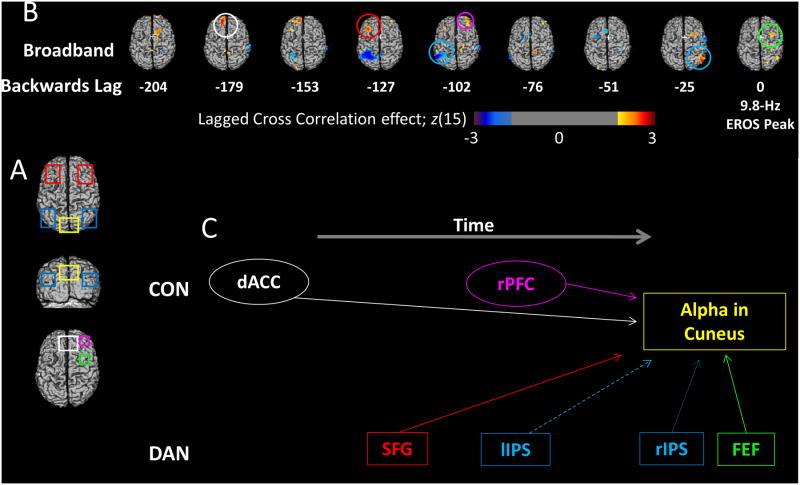
Figure 7.
Cross Correlations. (A) The ROIs used for cross-correlation analyses. (B) The results of a lagged cross-correlation analysis using as a seed the time course of EROS alpha power at the point in the cuneus (see from Figure 5) where this power maximally differentiates undetected and detected targets. This activity is cross-correlated (with varying negative lags) with the time course of the time-domain broadband EROS signal (also obtained by subtracting the undetected from the detected condition) for each voxel. The cross-correlations obtained from each subject are then Fisher-transformed and subjected to statistical parametric analysis across subjects testing their difference from zero. The z-scores associated with this parametric analysis are used to construct the maps. The data from lag 0 are shown on the right. To the left of this, time courses shifted at each lag from -204 ms to -25 ms are shown, revealing areas of the brain that predict subsequent suppression in 9.8-Hz EROS alpha activity in the cuneus on detected vs. undetected trials. Red colors indicate areas where EROS alpha differences correlate positively with subsequent or concurrent cuneus alpha suppression, while blue areas represent activity that correlates negatively with alpha suppression. Colored circles represent the area and time point of maximal correlation in each of the given ROIs shown in (A). (C) Temporal progression of the correlations between each of the ROIs and the suppression in posterior alpha oscillations, considering the lags at which EROS activity for each ROI was maximally correlated with subsequent alpha modulations. Solid lines indicate areas that showed positive correlations with alpha power suppression at Lag 0 and thus may directly communicate with cuneus areas, while dashed lines show negative relationships. The hypothetical flow of information over time is shown progressing from left to right. The DAN areas are shown separately from the CON areas, revealing the different temporal relationships of these regions with cuneus alpha suppression.

